
Principal component analysis (PCA) is a useful tool for providing return groupings of different alternative risk premia strategies. PCA is a simple form of dimensionality reduction that is useful for factor extraction and data transformation. It can help further understand the differences in alternative risk premia relative to traditional equity and bond benchmarks beyond correlation or beta measures.
The following analysis is available in a thorough research paper, "A Framework for Risk Premia Investing: Anywhere to Hide" by Kari Vatanen and Antti Suhonen. We have looked at their work in previous posts on beta stability, "ARP strategies and market beta - Check the stability when constructing portfolios" and with cluster analysis in "Alternative risk premia and the advantage of cluster analysis".
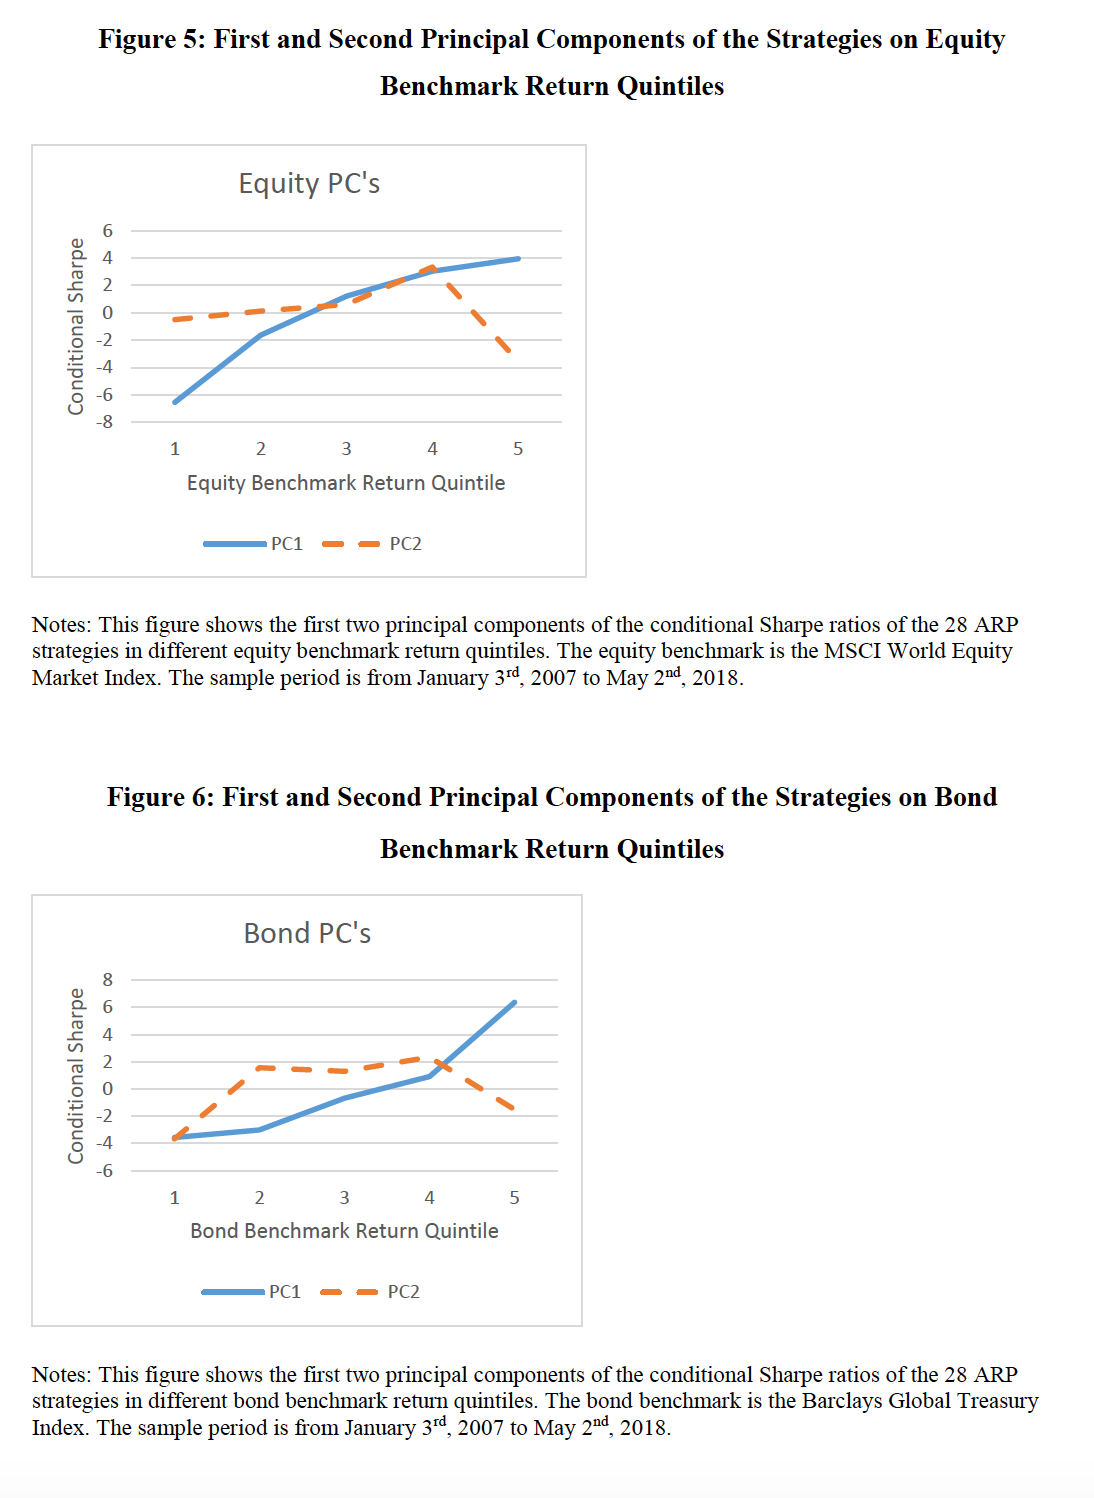
They show earlier in their paper the differences in equity and bond betas across return quantiles for equity and bond benchmarks. In another section, they run principal components on the Sharpe ratios for each return quantile for equities and bonds. ARP strategies seem to be concave with respect to equity returns and convex with respect to bond returns. A little deeper analysis suggest that with respect to equity returns there is a pattern for PC2 that is like a long call option ratio spread. The PC2 for bonds looks like a strangle.
ARP strategies do well in the mid-return range quantiles for equities but will tail-off for high and low returns. Of course, this is in the context that equity betas are still low across all quantiles. For the bond benchmark, there is also lower PC1 and PC2 at the lower quantile. While this information is interesting, the value is limited since this quantile research is looking at all strategies.
There is more information when you look at PC1 for both equity and bond benchmarks on a 2-dimensional plot for the bond and equity PC1. In this format, we can see there are clear "offensive" and "defensive" ARP strategies where an investor will be more positively (negatively) influenced by equity (bond) returns. This can be a helpful breakdown for ARP portfolio construction. Carry will get you more offense and trend will get you more defense.

Additional information can be gained by looking at PC1 and PC2 for equity and bond benchmarks. In the case of the equity benchmark, an investor can think about high PC1 and limited PC2 which is carry or low PC1 and mixed PC2 which include fixed income carry and value. There is a third group, which has high PC2 and mixed PC1, and could be considered equity neutral strategies. This category seems to be dominated by trend and momentum.

The first and second PCs using the bond benchmark seems to breakdown the ARP world into positive and negative PC1. These clusters seem to more well-defined than what is seen with using the equity benchmark.

No comments:
Post a Comment