Thursday, March 28, 2024

Value and momentum ARPs complement each other


The paper, "A Global Macroeconomic Risk Model for Value, Momentum, and Other Asset Classes" looks at why value and momentum is an good combination of alternative risk premiums as a portfolio from the perspective of sensitivity to macro factors.  Past work has shown that value and momentum complement each other given their low correlation, but there has not been a good rationale for this combination. The authors in this paper try to look at different macro factor loading to answer this question. 

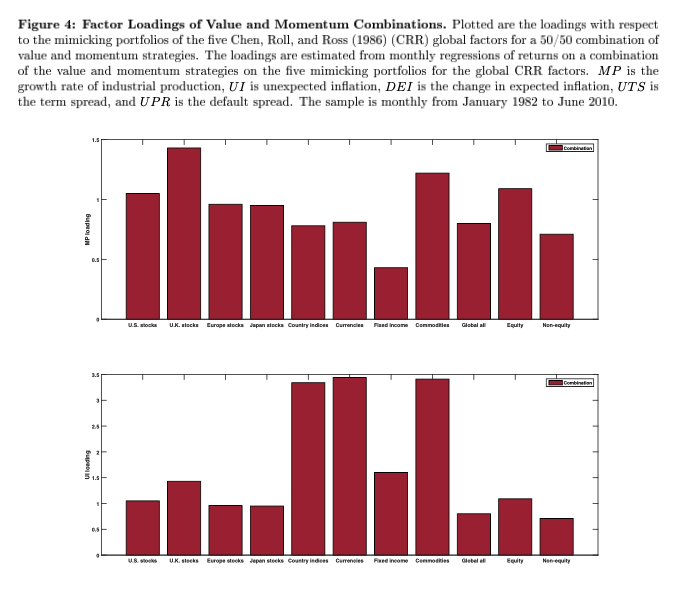
For their macro factors, they use the Chen, Roll, and Ross (CRR) macroeconomic risk factors. The CRR factors are a well-defined set which includes the term premium, default premium, industrial production, expected inflation, and unexpected inflation.

The negative correlation between value and momentum is caused by the different sensitivities to macro factors. Value has a strong positive load to the term spread but negative factor loading on all the other macro features. In the case of momentum, there is a negative close to zero loading on the term premium, but there are strong positive loading on the other four macro factors, growth in industrial production, unexpected inflation, change in expected inflation and the default spread. Nevertheless, because the factor loadings are different, it is not the case that forming an equal weighted portfolio between value and momentum will lead to a portfolio that is market neutral to macro factor loadings.  Changing the weights will give an investor a tilt to the loadings desired. 


Wednesday, March 27, 2024

New Fed Financial Conditions Index points to more liquidity


The Fed has developed a new measure for financial conditions. This is not the first measure, and it is not clear this is a better measure. There are several financial condition indices from brokerage firms and Bloomberg. The objective is the same for all these indices. They try and provide some indication on whether financial conditions are loose or tight. If the FC index is showing tight conditions, there may be a reason for the Fed to lower rates. Alternatively, if FC conditions are loose, there may be a reason for the Fed to tighten. See: "A New Index to Measure U.S. Financial Conditions."

The new Fed financial conditions index has a different take on what is measured. It looks at what is defined as the financial conditions impulse response to growth. It looks at the change in seven input variables which the Fed funds rate, the 10-year yield, the 30-year mortgage rate, the BBB corporate bond yield, the DJ stock index, the Zillow house price index and the nominal dollar index which are weighted using an impulse response coefficient that measure the cumulative effect of unanticipated permanent changes in each of the inputs with real GDP over some forward period. which is then called the FCI-G or financial conditions impulse on Growth. The index looks at the contribution to GDP growth for 1 or 3-years using three-month changes. 

Right now, the Fed FC index is showing loose conditions after a 2022 which showed tight conditions. Note that these financial variables will be impact by stability and their contribution to wealth creation. If the Fed follows this index as a guide, it provides a focus on financial well being. 


Sunday, March 24, 2024

Macro factor investing can exploit opportunities


"A Century of Macro Factor Investing - Diversified Multi-Asset Multi-Factor Strategies through the Cycles" explains how a portfolio of diversified factor strategies can be created to protect or exploit specific macro risk exposures through computing macro factor mimicking portfolios (MFMP). Using a wide a set of factors, the researchers create growth, inflation, defensive, and parity portfolios and then compare against different market environments. They find that these portfolios can effectively generate return during positive environments; however, there is the ongoing problem of predicting when these environments will occur. These MFMP portfolios will do better than portfolios just associated with macro factor exposures. 

The data show that defensive portfolios will do a good job across all environments and are well diversified.  The authors go on to show that creating portfolios that include forecasts on the macro environment and factor momentum will do better than static portfolios. Active management in a Black-Litterman framework can effectively add value to a portfolio of alternative risk premium.

Based on a century of data, ARP portfolios focused on macro exposures can add value over the long-term.


Saturday, March 23, 2024

The magnificent 7 stocks are just too big! Think again


The truth is that the U.S. stock market was far more concentrated in the 1950s and 1960s.  Looking at Schlingemann and Stulz (2022), for example, we see that:4

  • In the mid-1950s, just three stocks accounted for about 28% of the market cap of the whole market (Figure 8). Obviously, this implies the market then was much more concentrated than seven stocks being 29% of the S&P 500 today.

  • For many decades, the biggest stock in the market was always one of the following three: IBM, AT&T, or GM (Figure 6).

  • A single stock (AT&T) was 13% of the whole market in 1960 (Table 5), as opposed to today where our largest stock (Apple) is a mere 7% of the S&P 500.

  • In terms of employment, concentration was also far higher previously.  The authors write, “For 1953, GM is the top firm in market capitalization. It employs 1.39% of non-farm employees. In 2019, Apple’s employment contribution is 0.11% (or less than one twelfth GM’s employment contribution in 1953).”

4. Schlingemann, Frederik P., and RenĂ© M. Stulz. “Have exchange-listed firms become less important for the economy?.” Journal of Financial Economics 143.2 (2022): 927-958.

From Acadian 


Yes, I have been worried about the size of the "magnificent seven" and its impact on benchmarks and passive investing, yet the story is a little bit more complex. If you look at 1980 to the present, the sizes of these stocks are large as a percentage of the total market; however, if we go back further in time, we have a very different picture. I should have done more work to think about investment history.

The question is not about the size, but the distortion of the benchmarks that are used to handicap managers and are used for massive passive investing. If you invest in the SPX, you will have to give a large portion your money to seven stocks. We just don't know what will happen if there is an exogenous shock to the markets and there is a large exit from equities. Those seven will see a large outflows; nevertheless, does this create a special problem or will it just be a fact of life.

It is always about liquidity - It is not going down


We heard about the pace of QT potentially slowing by Fed Chairman Powell, yet a close look at the numbers tells an interesting story of a market currently full of liquidity. We have to first look at the total Fed balance sheet which includes Treasuries and mortgages. It is declining through QT, but the reverse repo program is also declining which is added back liquidity as investors buy Treasury bills which can be levered. Finally, the Treasury TGA must be subtracted from Fed assets. As the TGA account declines, this money will be injected into the banking system.

QT will be become more important once the RRP program falls to zero which will mean that liquidity will start to decline, yet currently there is no shortage. A liquidity issue will start to exist as we get closer to year-end.


Thursday, March 21, 2024

Maximal information coefficient - another way of finding data relationships


I have been disappointed with classic measures of correlation like the Pearson correlation. I have looked at Spearman rank correlation which should detect non-linearities, but I would like to have simple measures that can be better informative. Of course, there is the simplest of all methods - visual interpretation but that can be very subjective. 

I have recently come across Maximal Information Coefficient (MIC) which is an example of MINE (Maximal Information Non-parametric Exploration). 

The MIC is a way of finding two variable dependence that may not be captured with correlation. This is done through looking at relationships based on a bin or grid approach that compares entropy levels. It will provide a score that will be close to the coefficient of determination. It has roots in measure of entropy and information theory, so it is closely tied with advancements in machine learning. 

An important component is to calculate the relative entropy. We know that as Shannon information is the amount of uncertainty or surprise in a random variable, so as probability of an event increases there will be less uncertainty. Hence, the MIC will look for patterns that lowers the entropy that is measured beyond a linear relationship.

The specification can be found in software programs. I will not present the actual formula other than to say that give another interpretation of how two variables x and Y may relate.


Trend-following and the macroeconomic environment


The returns from trend following are associated with the business cycle. See "Time Series Momentum and Macroeconomic Risk ". While returns are positive in both recession and expansion periods, profits are higher in expansions. At first this result seems odd, the key narrative for trend-following is that it does well during equity crises. However, equity crises are not always associated or mirror the business cycle. Timing for describe trend condition is critical. 

The first table shows that expansions are better for trends whether based on NBER cycle or GDP data. The second chart looks at trend performance based on key macro factors. The results are suggestive that term premium is important while default rates are not strong for the more recent period. 

Returns are associated with economic risk factors and interestingly, time series momentum has higher returns when economic uncertainty is lower. Again, this may seem odd on first pass. More uncertainty means less trend returns; however, the story may make sense if you believe uncertainty creates noise and thus makes it harder to find a trend. Nonetheless, since uncertainty is just based on being above or below the mean, it is a weak conditional test. 

Focusing on macro factors is still an important area of research to determine of trend following can be conditioned on the environment.


Wednesday, March 20, 2024

Wealth effect or trickle-down - Are these the same things?


Liberals" prefer "wealth effect," while "conservatives" say "trickle down."

“Janet Yellen, when she was president of the San Francisco Fed, wrote a paper discussing the wealth effect, the doctrine says that the central bank can make the wealthy - the asset holders - wealthier. They can create wealth through money printing and interest rate repression, and so the wealthy people that have these assets become wealthier, and then they spend some of this money, and as they spend this money, it props up the overall economy, because it's part of consumer spending. So maybe they're they're buying a new house, or they're building a castle, or buying a yacht, and a new vehicle, and they're splurging on other stuff, and hopefully the yacht is made in the United States somewhere, and so there'll be jobs, and people make money - so this is the whole theory of the wealth effect.

Ben Bernanke explained to the stunned American public that the Federal Reserve is purposefully making their wealthy even wealthier, so that they feel wealthy, and feel rich, and spend a little bit more of their money, and you know hopefully prop up the economy. So this is an official doctrine, and there's all kinds of economists that have written about it, so you can Google that, and it has a very spotty record in in terms of helping the actual economy. It has a very solid record in terms of making the wealthy wealthier, but the trickle down effect of that wealth effect is pretty small, and you end up with this huge division in wealth, and so that's the principle that the FED did this on…

I think the wealth effect has been discredited, I think it's bogus, it's a fake doctrine, but that governed the Fed's action at the time, and it was well established in economic literature, and Bernanke explained it to the American people, so it's not something that Fed did secretly. It discussed it. It said this is what we're doing, and this is why we're doing it, we're going to make the wealthy wealthy, and hopefully they spend a little bit of that, it's going to help the economy, and that was the theory.”

Wolf Richter


There is a lot of food for thought in the comments by Wolf Richter. The Fed has pumped the economy with liquidity and has been slow to reduce this liquidity because of a fear of financial stress. Is Richter correct? To a degree, yes. The wealth effect has always been about an increase in wealth leading to more spending. More wealth is created for this in lower economic brackets, yet this also means that those who have more wealth will be the primary beneficiaries. Housing prices will rise, a wealth effect, but again you have to own the asset.  

Narrative is critical. A perversion of a story will lead to a negative reaction while a benign or good story will be accepted as good policy. 


Tuesday, March 19, 2024

Treynor-Black model as a simple experiment on active exposures


Sometimes a simple approach is useful of building portfolios. One of these simple approaches is the Treynor-Black model which builds a portfolio based on active and passive bets generate a portfolio that will be above the security market line. 

We start with the Treynor-Black ratio or appraisal ratio which is the alpha of a given stock divided by the standard deviation of the error term from regression withe market beta squared. This is the ratio of alpha to the square of unsystematic risk. 

The weights of the Treynor-Black model are based on the size of the weighted alphas which can be compared with the passive portfolio. The overall portfolio can then be adjusted to form an active portfolio and passive portfolio (1- active weight) that still has the market beta. 


The key issue is getting the right alpha measure. The Treynor-Black model just calculates alpha from past measurement, but forward-looking measures can be created to get a better subjective alpha which can be used to create an active portfolio.

Thinking a little differently about crisis alpha - Conditional drawdown at risk


There has been significant discussion about crisis alpha, but there may need to be a more general approach to the value of certain strategies in up and down markets. Perhaps an effective approach is to look at the upside risk and the downside risk conditional on a drawdown. This is a variation on upside and downside risk and asks a conditional question of how a strategy will do when the market is in a drawdown. See "Capital Asset Pricing Model (CAPM) with drawdown measure".

The question is simple. What happens to a given asset when the market is in a drawdown versus all other times. All crises will be subsets to market drawdowns. First, it is not hard to calculate the conditional drawdown at risk (CDaR) for any asset. From the CDaR, a drawdown beta can be found which is the beta when in a drawdown. This provides useful information on how any asset drawdown is related to the market returns (beta). 

If the drawdown beta can be calculated, there can be calculated a drawdown alpha which is different from crisis alpha; however, it is good comparative measure that is consistent over any other beta and alpha calculation. The drawdown alpha and beta can be used to compare hedge fund strategies. 

It is found that trend-following provides good drawdown beta and drawdown alpha relative to other hedge fund styles. There are other hedge fund styles that will also give you good drawdown beta and alpha. For example, a multi-strat approach and some fixed income RV can also do a good job. Hence, investors can form a defensive portfolio based on the drawdown beta and alpha to protect against a market decline. This approach can be an actionable way to build a crisis prevention portfolio. 

Monday, March 18, 2024

ARPs - stock and bond betas can be very different


Investors can buy alternative risk premium products across many styles and asset classes, but there are trade-offs between equity and bond risk. You carry strategies will often have positive equity betas but will also have negative bond betas. Alternatively, trend strategies will have positive bond betas but negative equity betas. Both have betas that are relatively low. This is one of the reasons why many investors or managers find the combination of trend with carry appealing. You give up some directional exposure; however, you gain protection between both up and own moves with equities and bonds.

The following analysis is available in a thorough research paper which has been recently published but can still be found in working paper form, "A Framework for Risk Premia Investing: Anywhere to Hide" by Kari Vatanen and Antti Suhonen. We have looked at their work in previous posts on beta stability, "ARP strategies and market beta - Check the stability when constructing portfoliosand with cluster analysis in "Alternative risk premia and the advantage of cluster analysis".

Saturday, March 16, 2024

Hedge funds versus ARP - Worth a hard look


The real battle in hedge fund land is the choice between buying a hedge or buying an alternative risk premia product often in the form of a swap. The ARP products were created to provide a low cost way of gaining exposure to long-short risk premia factors through total return swaps. The risk premium you have often seen described in the finance literature can be packaged in a form that does not have the same high fees as hedge funds and do not include incentive fees. 

They are not perfect. You must manage the exposure as opposed to having a manager control the risks, yet it provides a simple way to gain access to momentum, carry, and value across all major asset classes. This paper is a few years old but it makes a strong case for ARPs, see "Hedge Funds vs Alternative Risk Premia" by Philippe Jorion.

The burden is now on hedge funds to provide a unique return profile that is can dynamically adjust exposures or have a unique strategy that cannot be easily translated into an index that can be placed in a swap form. Bank risk premia swaps are intermediating the hedge fund market with exposure, trading, operating, and leverage expertise. In fact, the ARP products are cheaper so if they can closely match hedge fund gross returns, they will have a cost advantage. 

The development of ARP factor exposures is no different than the factor and index boom for long-only investing. If you can buy an index associated with a specific factor like size which will provide most of the desired exposure, the burden is on the active manager to provide alpha relative to that factor or benchmark.

Can you find better hedge fund? Yes, but now there is an alternative which places the burden on the manager to prove their value.   


Friday, March 15, 2024

Private equity dispersion a key risk


The table above is from the CAIS group and shows another risk from private equity beyond the standard deviation of returns over time. There is large dispersion  in return, much more than what is seen with traditional asset and hedge funds. Simply put, the risk of picking the wrong manager is much higher in the private equity space. 

The median return for private equity may be higher than traditional and hedge fund managers but the downside risk is more significant. Investor disappointment versus the median can be significant. This requires extra due diligence on the part of investors.  Yes, the upside from picking the right manager is higher, but everyone cannot be above average.

Thursday, March 14, 2024

SHAP and explainable AI - Getting to know your models


ML models are hard to understand relative to classic regression analysis. Some fear that ML is often a black box but there are ways to make these models more transparent or have interpretability. The tool most used for explainable AI is the SHAP values (SHapley Additive exPlanations) uses game theory to measure each player or in this case feature contribution to the outcome. 

Each feature is assigned an importance value which represents the contribution to model's output. Features with a positive (negative) SHAP value will have a positive (negative) impact on the prediction. These SHAP values are additive, so each feature can have a contribution to the final prediction and summed.  While the SHAP values can tell us the contribution to the prediction, it cannot tell us about the quality of the model. 

Given the properties of SHAP values, there several ways to display their information. It can be displayed as a waterfall graph which tells whether each feature is adding or subtracting from the prediction. The sum of all predictions will be equal to E[f(x) - f(x)]. The absolute value of the SHAP tells us the overall importance of the feature. Note, the SHAP values can be calculated for any prediction model. 

It may be interesting to measure the impact of non-price information on a prediction through using the SHAP value. There are many ways to use this tool to help refine forecasts and provide insights on non-linear relationships. 

The SHAP values tells us the importance of a specific feature observation, so information is often displayed as a bee swarm plot which tells us the impact of different observations associated with a feature.  You can also use violin plots which again will tell the SHAP value for specific observations associated with specific feature. Force, bar, and waterfall plots all tell us something about the drivers of our model, and all these tools are available in python.  

Wednesday, March 13, 2024

The information coefficient - Tell me model prediction skill


Measuring trader skill is critical to picking the right manager and just looking at the Sharpe ratio does not clearly answer the question. Of course, skill analysis requires a deep dive into decision making, but a first step is understanding the hit rate. 

The information coefficient (IC) does that:

IC = (2 x proportion correct) -1 where the proportion correct is the number of correct predictions versus the total predictions.

If the proportion correct is 50%, the IC is zero. if the proportion correct is 100%, then the IC is 1. You want to have a high IC, but it is important that a trader has a large sample of predictions from which to calculate the IC.  I want a high IC because it tells me, I am getting the direction right.  A good trader may have an IC above .05. 

The information ratio (IR) is the excess return relative to the amount of risk taken. Note that I can have a high information ratio on few predictions or few correct predictions. Good to see both. 

The active law of fundamental investing ties both of these concepts together. The expected return is equal to the IC times the square root of breadth (number of bets) times the standard deviation or risk taken. This means that the IR is just the IC times sqrt(breadth). There is added a transfer coefficient associated with the structure of the portfolio. It is defined as the constrained versus unconstrained active portfolio. That number in the simple case is equal to 1. 

For a quant model. tell the number of bets you take and tell me the accuracy of predictions from your model. The IC is very informative on model quality.  


A theory of investor choice - mix of positive and normative


No different than the view of Nobel prize winning professor Thaler in his famous paper "Towards a positive theory of consumer choice", a theory of investor choice is a combination of positive and normative views. There is the rational maximizing model which describes how investors should choose, and then there is the descriptive model of how investors actually choose. We must accept a description of investors is a combination of both. We are not pure rational, and we are not just a behavioral mess. We switch between the two. We strive to be rational but will fail based on our broad set of biases.

For example, there is prospect theory which is a good way to describe how investors act even though it is not what we would expect from a rational maximizing model.  Our behavior in up (winning) markets may differ from our behavior in down (losing) markets. This should not be expected in a rational model, but it is reality. Reality must be accounted for in our thinking and the thinking of others. If we only think about a rational choice world, we will fail. If we only think about a positive world, we will also fail if that world changes.

Monday, March 11, 2024

Non-consensus investing from Rupal Bhansali

Thoughts and quotes from Rupal Bhansali in Non-consensus Investing

"The signature element of an upside down investment process: it focuses on what can go wrong, not just what can go right." 

Great comment. Focus on the downside as well as the upside.

"You are exposed to a litany of risks with passive investing that are being glossed over.

  • crowded trade risk
  • valuation risk
  • redemption risk
  • liquidity risk
  • front-running risk
  • permanent impairment of capital risk 
  • behavioral risk
  • momentum risk"
Passive investing is not riskless investing.

"Investing is not a confidence game: it is about being more correct, not being more confident."

You can talk about the odds, but the main issue is always about being correct.

"Volatility is an opportunity because it only affects the stock price, while risk is a threat because it impacts the intrinsic worth of the business."

Volatility is a measure of risk not the actual risk. The risk is about what may happen different form what you expect.

"Investing not only must you be right, you must prove everyone else is wrong." 

Being right with the crowd does not help you.

"There is a difference between risk experience and risk exposure. You cannot really measure what you have not experienced." 

The real risk is what we have not experienced. 

"Margin of safety = heads I win, tails I do not lose."

Nice way to describe the margin of safety.

"The cost of the decision is not the same as the risk of the decision." 

Risk as measured by volatility does not tell you the cost of that risk. Need strong analysis of exposures. 

The idea that you have to be different from the crowd is critical.


Rupal provides a nice table on what you want to look for in quality firms.


Sunday, March 10, 2024

Being a Non-consensus investor - not that easy


The book Non-consensus Investing by Rupal Bhansali is a treasure of insights on how to be a better investor. It is easy to read and offers good advice. Sometimes it is too simplistic, yet I found two tables that were very helpful. One, how do you deal with behavioral biases? Two, what is the mindset you need to be a good investor? 

Follow the thought experiments and keep in your head multiple mindsets, and you will do well as an investor. Unfortunately, it is not easy to implement this type of thinking.


Saturday, March 9, 2024

Arrow's impossibility theorem and why investment committees don't work


For some odd reason, I was having a discussion with a friend on Kenneth Arrow and social choice theory. It came up when discussing the jungle primaries out in California. Arrow developed what has been called the impossibility theorem which states that if voters have three or more options or alternatives there cannot be a system that keep everyone happy based a criterion of fairness. I will not go into all the details; however, we should think about Arrow when we discuss how investment decisions are made within a committee.

There may be a set of views from each committee member. At the committee meeting, they will be asked to state or rank their views, yet it will be impossible to have these views fairly reflected in the committee decisions. There will be unhappy members and any voting scheme will not reflect fairly the member preferences. You cannot just have a committee vote and assume you will come out with the best answer. You will have an answer, but not one that will satisfy everyone, so the committee may go around and around until some decision is made. 

Perhaps it is better to use a model as a dictator or as the decider of what should be done? Everyone can provide and support the model, but the model will make the preference choices.  One voter and one source of action.

Misbelief - the next level of behavioral thinking


By this time everyone in finance and economics knows and accepts that there are behavioral biases embedded in our decisions. We will make mistakes. We are human but strive for rationality. The list of behavioral biases is always growing and constantly being sorted and grouped, yet many biases are in conflict, so it is not always unclear what is driving decisions. We also do not have a solution to behavioral biases other than to note that they will occur, and we should beware. Acknowledge bad behavior and stop it. 

The book Misbelief: What makes Rational People Believe Irrational Things by Dan Ariely is the next level of thinking about behavioral biases. Taken to some extreme, these biases will lead to misbeliefs and the acceptance of ideas and "facts" that are not true. Our biases can also distort fact or focus on only some facts to create misbeliefs. Behavioral biases can lead more than just the occasional mistake. 

The reason for misbeliefs is within us and is driven by emotions, cognition, personality, and the social environment. Our biases will not lead just to poor decisions but make rational people develop irrational beliefs that will create a world driven to an altered reality.  Ariely would say there is a funnel of misbelief which starts with our emotions and leads to cognitive mistakes. These mistakes can start to alter our personality. We will only look for what confirms what we want to belief. Once we focus on these misbeliefs, we look for others to help validate our thinking. 

Yes, these misbeliefs can occur with investment ideas which is why it is so important to be driven by the facts and challenge our thinking. Let a model serve as our null and as a guide.

The complexity of Adam Smith and the impartial spectator


I keep hearing people throw around comments about Adam Smith as if they have read closely all his work and understand what he was trying to say with his writings. There is the Adam Smith the caricature of capitalism and the Adam Smith of reality. Was he a great economist? He was able to popularize thinking about the economy as a system although he did not advance economic theory. The Wealth of Nations was written in 1776, before the great industrial revolution. You could say he was bringing principals of the enlightenment to explain the economy; however, he was foremost a moral philosopher.

You cannot think about the Wealth of Nations without knowing his earlier work, The Theory of Moral Sentiments. If the Wealth of Nations describes the economy and how it works or should work. The Theory of Moral Sentiments which came out in 1759 explores how decision should be made by individuals within the economy. 

He develops the idea of the impartial spectator. All that you do should be judged by a neutral observer who is looking over you.  You should be judged by or seek the approval of the neutral observer who can help us decide what is the right thing to do.  The effective machinery of capitalism works best not based on the invisible hand but the impartial spectator who will guide the course of action that will maximize all welfare. The economy is not a jungle, but an environment where self-interest is tempered by the observation of the outsider who is looking at our actions.

Friday, March 8, 2024

Global macro versus managed futures - Which is better?


An interesting paper, Global Macro and Managed Futures Hedge Fund Strategies: Portfolio Differentiators?, compares three major hedge fund strategies, global macro, managed futures, and long/short equity. All three generate alpha, but the alpha is different for each strategy when we look at returns through different factor lens.

First, the researchers find that the last decade plus, the post-GFC period, is very different than the pre-GFC period. There is no alpha for long/short equity, limited alpha for managed futures, and a strong decline for global macro.

Second, managed futures loses all its alpha when it is analyzed through an 11-factor model. Many of these factors are asset class trend so this is not surprising. The alpha decay for global macro is less given the different objective function away from trend. 

Third, the diversification benefit from hedge funds will differ when looked at through a drawdown analysis. Managed futures will best reduce the downside standard deviation and provide the best Sortino ratio, but it will come at some cost in excess return.  The researchers make a strong case for global macro, but if you are risk averse, managed futures still holds a place in the portfolio.