Wednesday, September 30, 2020

Tail events - Historical, Implied and Subjective Distributions


Macro tail events actually occur more often than what you may think. There will be a big negative shock every 2-3 years. We have had the luxury of an extended period of calm before the 2020 pandemic and March liquidity crisis. Unfortunately, the result of less frequent tail events is complacency.

We have discussed the tale of the tail and how to form expectations for tail events, but there are also some market information and indices that can help with measuring the increased likelihood of tail events.


Clearly, there is historical volatility that can provide scale for tail events. An increase in volatility will increase the likelihood of a tail event. The current volatility can be compared with the past as well as current  forward-looking expectations of volatility in implied values. 

Subjective expectations can be overlaid upon these historical and implied volatilities. We focus on three categories: policy uncertainty embedded in the news, surprise data, and financial stress and risk aversion indices. Higher policy uncertainty can lead to policy surprises.  Deviations in forecast will lead to trends and potential extremes as reality and expectations converge.  More financial stress will lead to greater negative market reactions. Theses indices may not forecast a specific event but may indicate an environment more sensitive to extremes. These indicators may help sway expectations of a tail event versus market expectations.   

Forming a tale about tail risk - The narrative matters

There is a current strong focus on tail risk by many investors, yet by definition, tail risks are extremely hard to measure or even describe. The presidential election, pandemic changes, geopolitics, and general policy changes are all the focus of investors as tail risks, yet to be useful these topics have to be quantified and placed in form that is measurable. By definition, there have been few shock events that have driven markets to the tail of the distribution. Hence, there is only a small sample. The frequency distribution is limited, so there is a clear focus on subjective expectations of magnitude and likelihood. 

There has to be a "tale" that creates or describes the subjective expectations for the tail event. There can be a simple process that can be used as a framework for any tail risk discussion. This is the risk assessment and scenario building of whether a tail risk may happen. This assessment analysis is a separate process from what action should be taken. 

The first question is whether the tail event contemplated has ever been experienced before. If it has been seen in the market, then extreme value theory can be applied with perhaps adjustments for the current unique situation. Extreme value theory can also be used as a prior to calibrate any tail analysis.

The alternative from using a prior similar event will be to formulate a subjective narrative for a unique tail situation. This requires a story of what will happen, when it will happen,  and the likelihood of the event. Of course, a tail event cannot be looked at in isolation. A shock to US equity markets will have an impact on bonds and credit, as well as spill-over to the rest of the world. Additionally, the policy response has to be modeled as a second order effect. Hence, there is a tale with a tail event.


After the tail event tale is developed, a hedge or action plan can be developed. Of course, an action plan can also be developed for a tail event that is not imagined yet expected. 


See: 

The Tale of the Tail - Focus on the where, why, and what is wrong; Use strategy diversification as a solution


Tuesday, September 29, 2020

China growth - Where to turn to for policy analysis


China looks to be the potential driver of the global economy given the evidence of stronger relative growth from official numbers. Any global economic and market success will be closely tied to China success just like with the Great Financial Crisis. However, there is a fair amount of disagreement on the actual numbers coming from China and the composition of growth. China export trade has increased but for global growth, China has to generate a robust domestic consumer market with increased imports. The size and type of China growth is relevant for the rest of the world and the policy choices by China are critical for macro forecasting.

So, where do you turn to for good China information? Obviously, there are the usual news source and economic data and a number of firms have developed their own economic growth indictors, but more important may be the overall China policy analysis. I use three unbiased sources for forming a China macro picture which will be slightly different from what is found in the writings of brokerage firms and major news outlets:

1. The China dashboard from the Asia Society provides comprehensive quarterly analysis on a range of China topics, see chinadashboard.asiasociety.org.

2. The China center at the University of Southern California for current thinking on China policy, see china.usc.edu.

3. The China macro reporter by Malcom Riddell provides regular timely information and links to important thinkers and policy discussions, see chinadebate.com

These websites do not provide market forecasts, but they provide good context and analysis for any top-down discussion. 

Thursday, September 24, 2020

Lumber and momentum crashes

Lumber futures prices are significantly higher than March levels as of the current close. Prices have increased more than 50 percent since April 1; however, prices have fallen nearly 25 percent since the high at the end of August. It will be noted that the lumber futures are not a very liquid contract so price moves can become exaggerated on limited trading.


Big moves and reversals define the life of trend and momentum followers. Follow the trend, but the more extreme and more money made will place greater risk of a reversal. These reversals are natural, but they are especially violent and can be called crashes when associated with a long strong price move. Momentum strategies can see negative skew on a trade basis which has been offered as an explanation for the momentum risk premium. We highlighted the lumber move and risks almost on the date of the high. See A surprise commodity demand shock - the case of lumber.

Very strong trends, usually up trends, lead to violent fast reversals. Call it a reverse of herding, liquidity cascades, crowded trades, or bubbles, trends often end poorly even with a strong long-term gain. Late trend entry can be devastating. Pyramiding can also be painful. However, the early trend identifier can be rewarded even with a crash on reversal. The reversal risk is a cost of following trends.  

The key solution to this crash risk is some form of stop-loss risk management.  Fixed risk rules provide a binding constraint on behavior that may want to hold positions for too long. It is not by accident that stop-loss structuring is so critical for trend-followers relative to other strategies. In fact, the risk management and trend reversal analysis are the two areas often overlooked but clearly critical to differentiating trend-following firms. 

The impact of higher lumber prices is still present for the housing industry. Lumber price are significantly higher than 5 and 10-year averages and still at levels impacting supply and demand decisions. The news for traders is still the same - if you follow longer-term trends, always have an exit strategy.  

All the focus on the left tail but what about a right tail event?


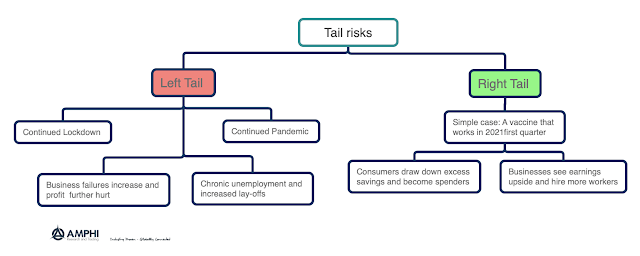
Most of the talk from market analysts has been focused on left tail events. Protect your portfolio against those left tail events. The harm is coming. We need more fiscal stimulus because there will be a left tail economic event. We need dovish monetary policy until 2023 because there will be a left tail economic event. We need to be aware of a second COVID wave, another left tail event. Business are failing and workers are not finding jobs, a left tail event is developing. All of the focus has been on the downside. From a macro-prudential policy perspective, this makes perfect sense and is warranted. An investor should always anticipate the downside; however, an investor should at least consider a right tail event especially with vaccine predictions rising.

What if there is a vaccine in the first quarter of 2021, and most lockdown measures are lifted? What if current positive testing moves decidedly downward? What will happen with the markets and policy? Even a vaccine may not turn everything around immediately and a lockdown lift will not create an immediate reversal, but a positive right tail event will be a game changer that perhaps has not been fully discounted.


Clearly, the stock market and to a lesser extent credit markets have shown significant resilience. This price inflation is partially based on expectations of a recovery, but it is also associated with the strong liquidity and low discount rates provided by the Fed. Albeit a lower probability, a right tail event could jolt markets and cause a large reversal in expectations and policy. The average firm not just tech stocks will have a significant price increase and rates will move higher.

Both left and right tail ends are real and have to be considered. A bias too strong toward the left tail scenarios may be painful for the overly conservative investor.  

Wednesday, September 23, 2020

Incentives matter - So always looks for the incentives


Incentives matter always  - The Economist

Incentives matter sometimes - The Psychologist 

Money incentives matter - The Finance professional

What incentives matter - The Philosopher 

Incentives versus others matter - The Sociologist 

Past incentives matter - The Historian

A close professor friend said he focused a whole lecture on the issue of incentives in managerial economics, so it sees relevant to reinforce the simple message that incentives matter. It may not always be money that is the incentive, and it may not always be obvious what incentives make a difference, but consumers, producers, investors, buyers, and sellers all have incentive structures that drive their decisions. Our job is to find those incentives and how they impact behavior.

Policy choices have to be made in the context of what happens to incentives. If the Fed drives rates to zero, is there an incentive to hold cash? If private equity markets are not marked to market regularly, is there an incentive to buy this asset class? If the capital requirement for holding government bonds is zero, is there a strong incentive to hold these bonds? Employees don't also respond to monetary incentives, what are those alternative incentives?

There are both carrot and stick or positive and negative incentives. Incentives can work in strange ways and the good analyst thinks through all the incentive permutations to get at the core "incentives matter" question.


Tuesday, September 22, 2020

The Fed 2023 policy - What does this mean for asset allocation and market themes? Limited choices

It is not a new or surprise policy but the Fed comments that low interest rates will likely be maintained through 2023 send a clear forward guidance message that clarifies that we are on dovish policy course. Although dissension is for an even more dovish forward guidance. Investors now have to adjust to this clarification and the choices are not overly attractive. Sure, continued Fed liquidity with the same level of Treasury and mortgage purchases provides support for risky asset purchases, but the law of unintended consequences suggests that too much of a good thing can lead to bad results. 

The choice problem is simple. With Treasury pushed down to low levels for years, investors will not get any benefit from holding bonds. Equities will gain tailwinds from a low discount rate, but we are already at high valuations so these low rates will push markets further into bubble territory. Choose between rates pushed artificially low or invest with equities that are pushed artificially high. This is coupled with other themes of distortions or choices to undertake risks that forced upon investors because of traditional asset distortions.


Monday, September 21, 2020

No crisis alpha with this crisis - The form of the crisis matters

There has not been any crisis alpha within the CTA space for this crisis. CTA return performance suggests that there was no crisis and the actual gains in stocks and bonds do not show a crisis when looking at year to date numbers. The liquidity crisis of March seems like just a bad dream. A sustained decline in equity prices is needed over an extended time period translate into CTA crisis alpha performance.

A close look at the largest managers in the Nilsson Hedge database shows that there generally has not been any "crisis alpha" from these managers in 2020 as measured through the end of August. The average return for the set of large managers is -.88% with the 25th and 75th percentile respectively -2.48 and 1.25 percent. The size of the managers ranged between $9 and $1.85 billion in AUM and represents just over $148 billion in total investor capital. 


The major CTA performance indices are up just under one percent, but there is a noticeable difference between the large indices (BTOP50 and SG CTA) and the broader indices which include all managers. Large CTAs have not been nimble during this period. Simply put, all crises are not alike, and the largest managers may not have found a way to exploit sharp short-term shocks.


Friday, September 18, 2020

Money market prime funds closing, and shadow banking system is restructuring

Money market government funds have grown in AUM this year, but the money market asset management business is again going through an existential threat from the Fed, as well as coping with the 2016 regulatory changes. The 2016 SEC changes created just two major money fund categories, government and prime that caused a major change in investor positioning. The March liquidity shock coupled with zero rates makes prime fund even less palatable to manage.

The money market fund managers have been in this position before but now managers are changing their business models. Vanguard, Fidelity, and Northern Trust are closing their prime (non-government) money funds. Fees cannot be charged on funds with such low interest rates without generating a negative return. The threat of variable NAVs is even greater when faced with large prime outflows seen earlier this year, limited liquidity in corporate short-term funding, and higher credit risks. Prime funds have come off their lows after the March outflow shocks, but the dollar inflows have not been near the increases in government funds. Prime fund AUM have not matched pre-2016 levels so this asset management sector is no long viable.


The impact of these large managers closing their prime funds cannot be understated. A major source of non-bank corporate financing will be closed and further harm the commercial paper and non-government money market.

The money fund and commercial paper shadow banking markets are just a shell of its former self, albeit the current spreads do not reflect this restructuring. Outstanding commercial paper has fallen and may reach the same lows as 2016. The Fed formed a commercial paper facility to help this market, but it was not extensively used and the blow-out in spread has made this a risky funding source as well as a risky investment. 


After a period of spread widening and high volatility, average commercial paper for A2/P2 borrowers are now on top of LIBOR, but that does not change the risk to borrowers who have to be concerned about the ability to roll-over debt. While corporate borrowers can take advantage of low rates further out the yield curve, the short-term funding market is facing a period of major restructuring. 

Wednesday, September 16, 2020

Alternative risk premia timing - Success through nowcasting


Alternative risk premia (ARP) have been shown to have unique return profiles from the market risk premium. Building diversified portfolios of style factors can provide an alternative return stream from traditional assets. The ARP are time varying and seem to have performance that is correlated to the business cycle. For example, the equity value premium will do especially well during an economic upturn or recovery. It is natural to then attempt to exploit these time varying returns to add value relative to a simple unconditional diversified portfolio.

The problem is not whether the conditional ARP returns change with the market environment, but whether investors can determine the regime being faced. If we can predict or forecast the market regime, we should be able to adjust the portfolio for improved efficiency. A simple solution is to employ forecasting advances such as nowcasting to help with regime identification. 

Using a straightforward application in nowcasting, the Cross Asset Solutions Group at Unigestion generate dynamic out-of-sample portfolios that improve over an equal risk portfolio of ARP strategies.  Nowcasting of growth, inflation, and market stress are used to predict the market environment. Taking a large number of current economic variables, the team create z-score averages and diffusion indices to provide timely measures of market and economic environment. The work also includes a simple valuation metric for ARP allocations.  Their analysis covers a wide set of ARP across major asset classes including equities, bonds, commodities and currencies. The styles analyzed include value, carry, trend/momentum and volatility. See "Factor Timing Revisited: Alternative Risk Premia Allocation Based on Nowcasting  and Valuation Signals".     
The nowcasting approach is atheoretical. It uses current data to generate a forecast of the growth, inflation and stress regime. The growth nowcast tells us whether we are in a recovery, expansion, slowdown, or recession. The inflation nowcast looks at the combination of a 2x2 between low/high and rising/falling inflation. The market stress nowcast using a similar 2X2 framework of level and change. These nowcasts are not traditional point forecasts but regime representations.

Using the regime frameworks, it is clear that ARP performance will change based on the growth regime. Conditional excess Sharpe ratios show the added value from the full sample. There is enough return variation for nowcasting to add value.

The authors look at five out of sample portfolios: a benchmark equal risk contribution (ERC) portfolio, a dynamic macro nowcast, a dynamic sentiment nowcast,  a dynamic valuation portfolio based on variation from average returns, and a dynamic combination portfolio. The dynamic portfolios all add value. Clearly, using some form of regime forecasts help with area ARP allocation decisions. The behavior of cross asset ARP is time varying with macro. sentiment, and valuation and can be exploited through nowcasts.

Tuesday, September 15, 2020

News sentiment index from SF Fed is useful


We have seen over the last few years indices aggregating news stories associated uncertainty. There are now complete suites of uncertainty indices, see Economic Policy Uncertainty. The uncertainty index methodology is based on three components. One component quantifies newspaper coverage of policy-related economic uncertainty. A second component reflects the number of federal tax code provisions set to expire in future years. The third component uses disagreement among economic forecasters as a proxy for uncertainty.

There is now a new index from the San Francisco Fed Research Department that focuses on sentiment from news stories. This Daily News Sentiment Index is a high frequency measure of economic sentiment based on lexical analysis of economics-related news articles from leading newspapers. The index looks at news stories from a wide range of publication and uses a sentiment scoring method based on economic news lexicon to make predictions on consumer sentiment. This is different than the focus on policy uncertainty indices. 


The news sentiment index shows a steep sell-off during recessions consistent with a fall in consumer sentiment; nevertheless, there are also some sharp declines during non-recession periods. 

The link between the news sentiment index and the stock market is mixed. The news sentiment is a high frequency index, so it shows significant variation versus the trend in stocks. As usual, the market often follows its own mind and does not match news sentiment; however, sharp extreme drops below zero suggest weakness in stock prices. 

Exploratory and confirmatory thinking - Too much of the latter and not enough of the former


Reasoning can be broken into two major types, exploratory thinking, the evenhanded consideration of alternative points of view, and confirmatory thinking, the attempt to rationalize a particular point of view. We spend a lot of time on confirmatory thinking because it justifies our point of view. We prove we are correct through our confirmatory thinking. Exploratory thinking is hard because it requires us to think beyond our current point of view. Exploratory thinking may have to accept that our conventional thinking is wrong. 

This thinking is different from exploratory and confirmatory statistical analysis. Confirmatory analysis focuses on hypothesis testing, determining whether a statement is true or false. Exploratory analysis looks for new data links that will lead to potential hypotheses. It is just trying to determine what data have to say.

The exploratory and confirmatory thinking dichotomy was developed by Jennifer Lerner and Philip Tetlock in Emerging Perspectives on Judgement and Decision Research. This dichotomy describes one of the key problems with any investment analysis. Most analysts will provide you with strong confirmatory thinking about their positions. Little work will focus on alternative inconsistent with positions taken.

Tetlock states, "A central function of thought is making sure that one acts in ways that can be persuasively justified or excused to others. Indeed, the process of considering the justifiability of one's choices may be so prevalent that decision makers not only search for convincing reasons to make a choice when they must explain that choice to others, they search for reasons to convince themselves that they have made the "right" choice."

With confirmatory thinking, there is the desire to focus on my-side explanations. We want to be right and not have to admit any mistakes so we look for data and stories that accept our specific view of the world. Exploratory thinking focuses on why, but without any preconceived notions of what should be the answer.     
Always ask the simple question. Are your arguments for an investment position just confirming your conclusion or are you also looking for alternative explanations? 
See:

Smart investors not immune from my-side argument bias


Monday, September 14, 2020

Exogenous versus endogenous risks and the tech sell-off


A recurring story concerning the recent tech sell-off is that option trading is the culprit. Retail and other investors excessively traded options to gain highly levered positions in a selected number of stocks that have shown strong momentum. The option call buying provided a positive feedback loop which further increased prices. With a small price reset and slight change in expectations, price started a sharp decline as option positions were exited. The technical reasons for this option effect include short-dated call expiration, gamma trading, and leverage loses. All are valid, yet the prior strong option buying activity was not predictive of a future sell-off.

Still, it is a good time to review the two major types of risk faced by investors, exogenous and endogenous. Exogenous risks are outside shocks to the market such as new macro information or company news. These exogenous risks change valuation and expectations. They also make sense to investors. Endogenous risks are price variability associated with the internal dynamics of markets. These are often temporary and are associated with the dynamics or imbalance of market participants. For example, excessive option trading creating feedback effects is an endogenous risk. 

Most investors focus on the exogenous risks. What will happen with earnings? How do I prepare for the unemployment number or the Fed meeting? Less time is focused on the changing dynamics associated with the behavior of economic players in the market, yet these can cause significant short-term distortions in price which trigger portfolio adjustments based on changing volatility.

Fundamentals or exogenous risks will drive prices to new valuations or equilibrium levels while endogenous risk or shocks will cause distortions from valuation which create a gap between value and price. The option activity is an endogenous risk that must be accounted for, but it is not the same as a fundamental change in valuation. The endogenous risk can cause feedback loop problems that trigger risk stops, but not valuations. 

The tech sell-off is real and unrelated to fundamentals; however, some of the tech excess returns were also unrelated to fundamentals. Investing and trading requires assess of both exogenous and endogenous risks.

See the following for other references

Exogenous vs. Endogenous Risk - It is an endogenous risk year

Saturday, September 12, 2020

Smart beta ETFs are not so smart after launch


The ETF revolution has expanded beyond core benchmarks to smart beta products which represent specific factor exposures in a liquid fund form. As the market moves beyond simple benchmarks, there are more choices that have to be made by the fund creator and investors. While rules-based, these smart beta ETF offerings both require and offer some structuring skill by the issuer. 

Structuring flexibility within ETFs creates back-testing issues. Rules are generated and tested to create strong performing benchmarks, yet more conditional rules increase the likelihood that performance of the past will not be repeated in the future. Conditional rules optimized for a specific past market environment or date test set may not be robust to future environments.

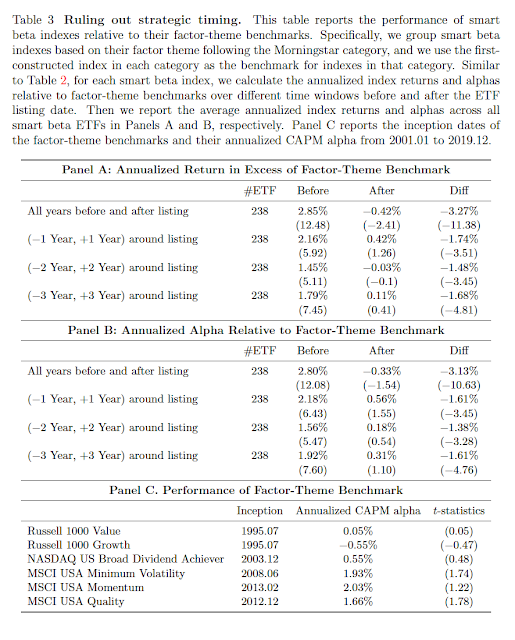
A close look at smart beta ETF performance after launch shows that post-launch returns have not matched their pre-launch return hype. Behold, fund offerings suffer from back-testing bias. See "The Smart Beta Mirage".

One could argue that this problem is just a matter of timing or subject to just some style categories. In reality, the smart beta return decline is pervasive. Others could argue that the decline is related to a declining trend in risk premia returns. Again, the data do not support this argument. We are left with a data mining problem, and a more customized the smart beta offering has a greater post-launch decline.


This represents the dangerous intersection between marketing, asset raising, and research. Firms want to launch a successful product that has value versus some benchmark. Rules are explored and tested until the product shows outperformance over some past history. The marketing department loves it. The potential gains in AUM could make this new product profitable. If there is no successful value-added in the back-test, the launch will never occur. The product is marketed based on those back-tested numbers only to see poor live performance. Call it product structure risk, but the investor is left with not smart but dumb beta. 

Friday, September 11, 2020

Gold as the currency of last resort against debasement risk


"I don't like dollars, but I also don't like any other currency..."

"Gold, when you absolutely positively cannot find another store of value ...."


Gold has stabilized over the last month within a range around 1950. This range has occurred even with Powell announcement of inflation averaging and other central banks clearly continuing quantitative policies to boost inflation. 


Of course, generating inflation has failed over the last decade, yet one of these times central banks may get it right and the gold rise of 2020 signals that gold buyers think they may be successful. Nevertheless, history has not been kind to believers in a gold and inflation link. Gold is a speculative investment that reacts to the changing sentiment of investors to a range of factors.

To appreciate gold moves, investors need to understand the subtle distinction between inflation and debasement of a currency. Gold has generally been viewed as an alternative currency that is driven by expectations for this alternative versus other currencies.

Investors are actually looking for a debasement hedge against stores of value that decay from negative real rates. Where do you place money when existing store of value decay? It is a relative decision which means that looking for a  gold and inflation link is not good enough. 

Inflation is simply an imbalance between supply and demand in the aggregate goods market caused by excess money. If there is economic slack, there is unlikely to be inflation. There can be a relative price shock but no general price increase. A currency debasement is focused on a real or perceived destruction of conventional money as a store of value which can be easily transferred into other assets or used for payments. Someone may not want to hold dollars because he does not have faith in role as a store of value. It can be caused by inflationary expectations or a belief in the financial and political integrity of the issuer to honor political and financial commitments. 

The cost of holding gold when real rates move further negative across all major currency alternatives becomes easy. If there is a threat of currency debasement albeit low, then there will be an increased demand for an alternative currency of last resort. If other currencies have a similar threat, the choice for gold becomes clear. Negative real rates, high risk for liquid assets, and high macro uncertainty fuel speculative switching to other alternative stores of value. Given this focuses on the perceived likelihood of rare events, the link between gold and current macro data may seem tenuous, yet investor demand a new currency alternative.  


Tuesday, September 8, 2020

Important questions and quantitative analysis ... Grappling with what is missing


"...almost all important questions are important precisely because they are not susceptible to quantitative answers." Arthur Schlesinger Jr "The Humanist Looks at Empirical Social Research" 1962 

Spoken like a true traditional historian, Schlesinger was arguing against the growing use of quantitative methods and the rise of cliometrics in the study of history. There is still a gulf between the traditional and scientific historians albeit much narrower than in the past. There is an acceptance that both quantitative and qualitative analysis are needed. 

There is a similar gulf between the traditional trader/ analyst and quants. I am a strong believer in quantitative methods in finance. Investments cannot be made without it, yet there is value with respecting the "humanist" position that alternative analysis is needed for focusing on that which is unexplained.  

Quantitative analysis is an important tool for finding the systematic or recurring behavior in markets, yet there is a significant amount of unexplained variation with any quantitative model. The big investment money is made through dissecting this unexplained variation. Still, because it is so difficult, it may make sense for many to avoid this work on the unexplained and only focus on the quantitative side. 

Providing answers to what is unexplained after what has been measured as repeatable is the true value-added from an analyst. While working on the quant modeling is rewarding, it still is critical to ponder the unexplained.

60/40 Stock/ bond asset allocation - All bond bull - But it continues


How many times have you heard that the 60/40 equity/bond mix is dead? Every time bond interest rates hit new lows; the argument is used. Every time equities decline; the 60/40 death argument is raised as a reason to change diversification strategies. Every time the stock/bond correlation increases into positive territory; the argument for moving away from 60/40 is employed. Nonetheless, here we are at the end of the summer with a simple 60/40 SPY/AGG at 8.35 percent for the year (9.68% for SPY and 6.37% for AGG).

Going back to basics, why is the 60/40 doing so well?

The bond bull continues - Bond markets have been in a bull market since early 1980's. While there have been some notable rate increases, annual positive bond total returns have been the norm. No alternatives have better bond returns especially after accounting for diversification benefits. The AGG bond return for 2020 has surpassed most equity diversification strategies such as small cap or international stocks. It has done better than low  volatility and dividend benchmarks.
The SPX benchmark allocation has worked - Large cap growth has supported holding the equity benchmark over any other equity allocation. The declining real rates over the bond rally period have supported equity exposures in the US.
The value of negative correlation - The zero to negative correlation between stocks and bonds has supported the 60/40 allocation over alternatives that have had positive correlation. 

The same questions as in the past have to again be addressed. Can US valuations continue? Can a bond rally continue? 

The bond rally - With interest rates again reaching lows and no indication that US rates will follow the rest of the advanced world and go negative, the bond rally could be considered over and bond allocations will be a drag on performance. This argument is based on the premise that the zero bound will not be breached. This premise may be wrong. Additionally, while Fed inflation averaging should scare investors, there is no Phillips Curve trade-off that makes inflation likely. 

US equities - The high CAPE value and heavy tilt to technology makes it hard to hold the equity benchmark. Stock performance may be low over the next few years but it is less clear that value, small cap or international equities will provide an alternative.

Equity/Bond negative correlation - The negative equity bond correlation is based on the low inflation environment. If there is no inflation, it is less likely that a positive correlation will arise. This correlation threat again takes us back to the flat Phillips Curve. Fed policy of reaching for full employment may not create conditions for higher inflation.

You may not like simplicity, but simple has still worked and will likely continue. Any change should be benchmarked against the 60/40 base. Change should only focus on close bond substitutes or alternatives forms of risky assets. Perhaps changes can be applied along the margin, but the core allocation of risky equity and safe bonds still makes sense. 

Monday, September 7, 2020

A flat Phillips curve, changing Fed goals, and asset allocation


Forget all the discussion concerning the Fed listening tours and deep policy review. The Fed policy of inflation averaging around two percent is just the final acceptance that the Phillips Curve is flat. The curve is as flat as a pancake so measuring the natural rate of unemployment does not matter. The same argument can be applied to r-star. There is no current inflation trade-off between employment and inflation. It took some time for policy-makers to accept the empirical flatness, but now it has become operational. 

Any handwringing about the trade-off between unemployment and inflation is now a false dichotomy. In a flat Phillips Curve world, the Fed does not have to worry that pushing for lower unemployment will be at odds with their inflation goal. 

Given that inflation is below 2% and the Fed has not been able to reach their goal for any extended period since the GFC, it is hard to see what they could do to raise inflation. The Fed can try to raise inflation, and markets can get nervous but there is little evidence of any "success" at reaching a target. The current inflation averaging policy just states that if the Fed can even see or get inflation above 2%, it will not react with any sense of urgency. 

What does this mean for asset allocation? 

Inflation reaction - If there is any expectation that the Fed will have a strong inflation reaction function as measured in the past, this view can be discarded. Any link between short rates and economic news is broken. It has been broken for some time, but the current Phillips Curve  solidifies what has been found in more recent market data. In fact, investors can discount any Fed discussion or reaction to inflation. This discounting does not mean investors should be unconcerned about currency debasement which is subtly different from inflation. Debasement means that other currencies and precious metals will be valuable.

Market mechanics focus - However, Fed policy will not be driven solely by unemployment. A growing Fed mandate will be to ensure the effective function of financial markets to provide liquidity and help distribute Treasury debt. A continued high deficit policy is only possible through the smooth functioning of the Treasury market. Liquidity mechanics will be a more important Fed function as the buyer of last resort and smoother of debt market volatility. The Fed will continue to be the dominant player in Treasuries and other debt markets. We will see more policy action solely based on market mechanics as opposed to macro fundamentals. This focus is the next step in macro prudential policies.

Fiscal policy ascent - The role of fiscal policy will dominate monetary policy which will focus on ensuring that fiscal policy can be executed. While the inflation averaging policy will mean continued Fed liquidity, the fiscal focus on growth will increase policy uncertainty. An advantage of monetary policy has been its swift response to any crisis. This generally has not been the case for fiscal policy. 

Some observers may feel the new Fed policy is not a change but a clearer representation of current reality, but a codification of reality only means that it will be harder to change in the future. For asset allocation, there is still a clear tilt to risk-on.

Saturday, September 5, 2020

Tech sell-off - We sort of know why....sellers exceeding buyers


"The market has gotten ahead of itself..." "Sellers overwhelmed buyers..." 
- The phrases used when we don't know why a reversal occurred. 

Tracking the tech sell-off over the last two days gave me a clear picture of the market. We don't know what is going on in the rational sense that there is fundamental information that has changed expectations. Theory and empirical evidence are suggestive that large sustained gains or loses versus a benchmark are susceptible to price reversals, yet that does not address the question of when or why reversal crashes will occur. 


It has been found that the momentum style factor exhibits negative skew and is subject to crashes or quick reversals. See Momentum Crashes. The momentum crash research was focused at the momentum factor, but the framework may translate to specific stock moves. However, the criteria for a momentum crash do not seem to fit the current circumstance. The market is not in a panic state and there is not a melt-up of poor performers. 

Clearly some of the large cap tech stocks have exhibited a strong positive run and would be in the top decile of large cap return performance for momentum. These stocks have also been screened for high growth. Reaching these two extremes are suggestive of a likelihood for reversals as prices normalize, but strong gains alone does not provide any specific reason for when or why it will occur. 

I would look to the herd behavior literature as another source for explanation. Again, herding creates positive feedback loops that will lead to extreme moves, but there is still the problem of explaining when the deflation or reversal of crowd behavior will occur. The herd  behavior school will state there is a focus of expectations that will change with new information that contradicts the status quo, yet again we are not faced with any new tech fundamental information. 

Alas, without new information, human nature will fill the void with explanations that are tautological or simply obvious yet dressed up as learned and deep thinking. Hence, we are given the more sellers than buyers story or extensive call option trading by Softbank being reversed through profit-taking. 

Markets move and these moves are often endogenous to the actions of agents independent of exogenous information. This is a fundamental risk that cannot be explained but must be accepted as part the trading experience. Things happen.