Tuesday, February 28, 2017

What are the potential yield risks with bonds?


There is still concern about the potential for large moves in bonds during the next three months.  The latest rolling yield changes shows a calming after the large moves late last year. Nevertheless, uncertainty on policy, growth, and the equity markets may all impact Treasury yields, the "safe" asset. If safe means limited moves in yield, investors may be in for a surprise. A flight to safety can easily take the 10-year below 2% while a pick-up in inflation or growth can lead to yields pushing closer to 3%.

Looking at the change in yields across the post crisis periods suggests that the risks are significant just based on normal bond movements. Over any 65-day trading period for the 10-year constant maturity Treasury index there is a 20% likelihood that yields will move by more than 32 bps up or down. At the current yields, we could easily see yields above or below 2.70 and 2.10 over the next three months. More importantly, there can be a move of more than 100 bps up or down over the next quarter, albeit the probability is about 1% using data over the last seven years. What is clear is that a return to sub 2% yields or a move above 3% is not crazy talk even under a low rate environment.  


Bubbles everywhere if you know how to look for them


Markets have been known to move to price extreme which have often been referred to as bubbles. The best know of these bubbles have been noted to lead to large market dislocations in both financial markets and the real economy. The “dot com” and housing bubble are the best known most recent examples, but unfortunately, there has not been much agreement on what are identifiable characteristics or the cause of these bubbles. While there can be agreement that bubbles re related to positive feedback loops, there is little work on a method for filtering data through some general model that will define a bubble.

The Financial Crisis Observatory (FCO) at ETH Zurich, formed by Didier Sornette, has developed models for identifying bubbles in financial market indices, sectors, and stocks through what it calls the FCO Cockpit.  Given a well-established model based on price with explicit probability measures for a market reversal, the FCO can identify financial markets that are likely in a bubble state by looking at price behavior. 


In reality, there are bubbles all over the world in many markets. There have been significant positive bubbles with large market increase as well as large negative bubbles from extreme market declines. Unfortunately, there has not been a generally accepted definition of what is a financial bubble. Bubbles are more frequent than what you may think as measured by the FCO.


The FCO uses a model that can identify bubbles which also have a high likelihood of bursting through a change in regime. The model looks for price characteristics of a hyperbolic power law and distinct oscillations that usually lead to a price behavior adjustment, reversal, or crash. Simply put, markets that are rising faster than an exponential with greater oscillations are candidates for a bubble. When these characteristics exist, there is a high likelihood of a reversal. What cannot go on for long, will not. 


While the fitting of this model is not easy, it provides a framework for comparing large numbers of markets in order to identify bubbles through only looking at price data and not relying on some fundamental valuation or model framework.  This is important because an investor can use the output from the FCO through their monthly FCO Cockpit -Global bubble Status Report to identify potential bubbles.


An investor does not have to agree with the FCO on whether the market is showing a bubble, but there is now a well-defined way to identify markets that have bubbles. The FCO identifies markets, sectors, and stocks that fit the LPPLS model and lists them every month. The list can fluctuate from month to month but it is not always short. Bubbles are more frequent than you may think. 


Saturday, February 25, 2017

Preqin survey - Lower allocations to macro and managed futures


A close look at the investor intentions for hedge funds suggests that poor managers will see their allocations reduced this year. The proportion of respondents who will reduce their allocations is at the highest levels reported and about 20% higher than last year and more than double from two years ago. Similarly, the survey has lowest level of respondents willing to increase their allocations. 

So where will the allocation declines come from? The allocation plan survey shows that fund of funds and managed futures will see the most respondents with decreases in allocations on an outright basis. Another way to look at the allocations changes is to take the net between allocation increases and decreases. In this case the biggest net declines will be with activist, fund of funds, emerging markets and managed futures. It is notable that there are some strategies that will see both large expected increase and decreases in exposure like macro and equity strategies.


We  know that expectations are often backward looking. Poor (stronger) performance last year will lead to lower (higher) allocations this year; however, it may not be the case that this serves as a contra-indicator.  There is not enough evidence to say that poor returns for a strategy last year will lead to higher returns this year. What is clear is that while 60% of strategy exposures will be maintained or be "safe", 40% of allocations may be in play. Managers will have to earn their spot in an investor's portfolio.

Friday, February 24, 2017

Preqin survey - Investors frustrated with performance


Hedge funds are frustrated, as evidenced by the recently published Preqin Investor Interviews. If hedge funds do not perform this year, there will be significant changes in allocations. The number of respondents to the survey who said that returns fell below expectations increased by 50% in one year to the highest levels reported. Only 3% of investors believed that returns exceeded expectations. This was tied for the lowest levels reported. 

The highest levels of frustration was with discretionary CTA's where 73% of respondents believed returns fell below expectations. Macro and systematic CTA's both had returns that fell short of expectations as measure day the survey of more than 50%. The only strategies that had higher levels of expectations that fell short were equity strategies and activist managers.


The low returns for this year has led to reduced confidence in hedge fund managers over the last 12 months. 47% of investors have reduced their confidence levels with only 10% saying they have increased confidence in hedge fund managers. This reduced confidence is coupled with over 50% of investors believing that hedge funds will perform worse in 2017. 


There is a real reason for manager concern given the quick trigger on performance shortfall tolerance from investors. The Preqin survey shows that 45% of investors will not tolerate underperformance for a year or less and just under 60% will tolerate underperformance for 18 months or less. Every hedge fund that underperformed last year should be on notice that they will be watched closely.

The state of the hedge fund industry is poor when we have close to 50% reduced confidence and more than 50% of investors believe that performance will do worse in 2017. There should be a need for better marketing to help shape expectations, but the real issue is for managers to perform with returns that meet expectations. There will be return shortfalls, but for any set rolling time period there has to be returns that exceed risks while providing a diversification benefit. If that does not happen money will move in new directions.

Why is forecasting difficult in commodities - Innovation


Forecasting is difficult for any financial asset, but it can be especially difficult for commodities. There are the peculiarities of futures, the potential for large supply shocks, and just the higher volatility associated with the varied interaction of hedgers and speculators, but there is also something that makes medium-term forecasts especially difficult - innovation. Innovation and technical change will impact production sensitivities in a way that makes past information difficult to use. Innovation changes the sensitivities to supply and demand shocks and because innovation is implemented through time, there is not usually a well-defined implementation date.

Innovation changes the costs of product. When innovation lowers the marginal cost of production, supply will not be reduced until prices fall below the marginal cost. We have seen this issue with the price of oil. The marginal cost of production has fallen through technological change in shale drilling and discovery. Hence, prices had to fall further before a firm's production became unprofitable. The result can be deeper price declines and a cap on price increases.

Innovation can change price behavior to outside shocks. In the case of plant genetics and specialized seeds, production can be less sensitive to drought, insects, or blight. The result is that negative shocks do not have the same adverse impact on prices. Crop yields can continue to rise and show less seasonal sensitivity.

Innovation can increase demand. The processing of foods can create more demand for agricultural products which my be less sensitive to price. In the case of natural gas, improvement in power generation can increase demand.

Innovation in regulations impacts supply and demand. Changes in regulation such as a carbon tax or ethanol usage will impact supply and demand. Innovation on gas mileage driven by regulation has changed demand for gasoline. 

The response by some traders could be, so what. Innovation is long-term phenomenon that should not effect prices of forecast of less than a year. Yet, our reading of fundamental data suggests that innovation can make past history less useful and thus make future forecasts more difficult. This is one reason for the focus price relative to fundamental data for these markets.

Willis Towers Watson survey - what does it tell us for 2017?

The Willis Towers Watson Global Pension Assets Study 2017 shows that the same pension trends for the last decade continue. First, the march to defined contribution (DC) plans from defined contribution (DB) plans has not abated. Of course, there are some wide variations across countries, but the good old days of getting a managed pension from a company or a state are not coming back. Second, the growth in pension assets from the major countries is slowing but continues to rise in emerging markets. Emerging markets do not have the same developed pension systems and often have pension assets well below the country GDP. There is a catch-up in EM and this is where asset growth will be seen. 

My focus on reading these surveys is generally on the asset allocation issues for pensions where we see some major differences across countries. Foremost is the plain fact that most pension hold less than 50% of their assets in equities. The impact on fixed income from yield changes is still the main driver of performance. Pension will continue to be faced with lower returns with the current low rate environment. 

For the US, the asset allocation mix is tilted toward equities and other which will be the alternative space. The high equity exposures are a Anglo-pension focus. There seems to be a clear view that alternative can serve as a fixed income alternative. There is a potential catch-up in this allocation for other countries. Overall, for the largest seven countries with pension assets, there is a decline in equity exposure for alternatives. This trend has been in place before 2008. 


There is a clear difference in preferences with pensions. On the one hand, there is an equities plus other approach that is the focus of the Anglo countries. On the other hand, there is a strong fixed income focus for Europe and Japan. Perhaps driven by demographics and local regulations, but there are clear allocation differences that impact global demand for all asset classes.


Friday, February 17, 2017

It is all about the volatility management


For many investment strategies, the difference between a good and a bad manager is based on their ability to manage risk. It is as much about how volatility is handled as return generation. A good strategy which does not manage risk well will never be truly successful. 

A key conclusion from a recent paper that focuses on volatility and factor management show that controlling volatility provides significant enhancement for many factor-based strategies. If you control volatility, you will get a positive bump in the return to risk ratio. 

This is at odds with the convention wisdom of some in finance who believe you have to be in the market during risky periods like a recession to gain extra return. You get paid to take risk during periods like a recession. This new research says that it does not matter when you invest in the business cycle. Managing risk will improve performance and that means cutting exposure when volatility is high. Timing market volatility will help with any investment strategy because volatility is generally independent of return. Put differently, if you control the risk, you will be better off versus a simple buy and hold for a given factor exposure. 


This is all explained clearly in the paper "Volatility Managed Portfolios" by Alan Moreira and Tyler Muir. Their approach to volatility management is very straightforward which make their conclusions so powerful. The authors scale exposure by the inverse of conditional volatility while focusing on the classic Fama-French factors and carry. Since volatility is persistent, variable, but not highly predictive of excess returns, managing or timing risk is not closely associated with the factors driving returns. 

The importance of this paper is evident once it is read in its entirety. The authors carefully address many of the concerns that reader may have and test the hypothesis from a number of different perspectives. While the enhancement from volatility management is not strong in all cases, the weight of the evidence suggests that volatility management is a key way for managers to enhance return to risk.


The real market skill for many managers may be with their timing of volatility and not returns. Cutting (raising) exposure at higher (lower) volatility periods seems to be a proven strategy for alpha generation and Sharpe ratio increases. This research provides support for a comment that I have often used, "I would only charge 75bps for a simple trend-following model but 125 bps and  a 20% incentive fee for the risk management." 

(Hat tip to Peter Golger for pointing me to this paper.)

News sentiment - It is worth following


Some may feel they are overloaded with news and it is just noise. Well, some new machine learning research suggests that following new is worth a second look. The news can provide a strong measure of sentiment that can improve forecasts versus using traditional fundamental information. This news sentiment is also unique and can add value versus survey sentiment information found in the long-serving Conference Board and University of Michigan work. This new research on sentiment is presented in the paper, "Measuring News Sentiment" from the Federal Reserve Bank of San Francisco

This work is important for those who want real time survey estimates and have started to employ nowcasting type of approaches to market predictions. The researchers looked at news articles from 16 major newspapers through LexisNexis from 1980 to April 2015. They use a lexical or "bag of words" approach and a machine learning approach through the use of natural language processing. The focus is to measure sentiment on two dimensions valence (positive or negative stories) and arousal (activation or deactivation stories). 

Using a number of statistical measures to determine the quality difference in models, the authors are able to conclude that using sentiment is better than just employing economic data. The use of news sentiment is also superior to models that employ the traditional survey data followed by many economists and investors. 


We cannot tell how sensitive this work is relative to other data formations, but the fact that a natural learning model and a lexicon-based model both show the value of sentiment suggests that there is something interesting here. The sentiment can be as simple as greater focus on pessimism and optimism, but it can add value.

Don't lock yourself in a room to separate yourself from the news. Follow the news and you may get a feel for where the economy is going based on the fact that the news embodies the view of many economic actors. The sentiment of these actors has real effects.

Wednesday, February 15, 2017

Living in a non-linear world


“Humans best process information when relationships are linear.” – William Sharpe 

Linear thinking with investment management is simple and easy. Give me a straight-edge and I can show you the connection between two events.  A regression is just the fitted line to minimize deviations between two variables. Draw a trend line and you can find the direction of the market.  A multiple regression can provide more information on conditional behavior, but it may not capture the true link between markets because it is still trying to fit everything into a linear world. The concepts and the math are easy in a linear world. Unfortunately, reality is more complex. Markets move differently based on the environment, who is trading, and the associated risks. 

A real value in investment management is finding when markets move higher or lower with acceleration; a non-linear event. For example, the relationship between inflation and unemployment and its link with rates is very different when the economy is running at the natural rate of unemployment versus periods when the economy is far away from full employment. When there is a market accelerant or catalyst, price can become non-linear. 

The key for any investor is knowing when relationships may switch from linear to non-linear. There can be countless example of when market behavior becomes non-linear, but our fallback position is to use linear tools. The reason for falling back on a linear world is simple, the thinking is intuitive; if X moves Y percent, there will be a known response in variable Z. Success comes from moving beyond what is easy. Learning to anticipate or model a non-linear event s difficult.

While we mostly process linear relationships, investment success is also predicated on our ability to create or find non-linear trades. The best investors look for cheap convex trades. This can be done through the use of options or through buying instruments that have positive convexity. By creating non-linear trades in a linear world, investors can create a return edge. 


Tuesday, February 14, 2017

Equity and bond volatility are different - A need for deeper thinking


A key issue with asset allocation and risk parity is the changes in volatility across asset classes. The foundation for risk parity is based on equal weighing of asset classes volatility as opposed to setting dollar weighting. Hence, knowing the relative differences in volatility and how they move through time is critical. We can describe some of the key issues associated with any volatility matching or equalization strategy by taking at a quick look at the CBOE VIX index for equity volatility and the TYVIX for Treasury bond volatility. The simple case of comparing these two major assets classes helps to describe the problem of volatility matching.

A quick comparison of the two option based volatility indices shows significant differences. Equity volatility has always bean higher than bond volatility, but the changes through time can be dramatic. 

The volatility of volatility for equities is significantly higher than bonds. Now there are differences in measurement, (change versus relative change), but by just looking at the absolute changes through time, you can see that equity volatility is more prone to spikes and these spikes do not occur at the same time as bond spikes. If both indices move higher, the equity volatility change will be more pronounced. While there have been two major extended equity volatility spikes since the Great Financial Crisis, even current markets will see more equity volatility spikes. Absolute VIX values may be low and declining, but there are still significant spike deviations from bonds.

Since there will be periods when equity volatility shocks will be different from bond volatility shocks, the correlation between the two volatility measures will show significant variation. A rolling correlation graph shows that equity and bond VIX will be highly correlated but also subject to significant negative correlation shocks where the market volatilities move in opposite directions.


For asset allocation based on volatility equalization, there will be significant adjustments unless there is a wide tolerance for differences. The difference in volatility can easily change by a factor of two. The link between volatility can move between .8 or higher and below -.4. There is significant room for variation and the factors driving equity volatility may differ from those associated with bonds. Clearly, inflation and central bank shocks will differ from earnings shocks. Volatility equalization can have benefit for controlling risks, but the costs of monitoring and adjusting allocations can be significant.


Sunday, February 12, 2017

Bond and equity flows - who is underwater?


Asset allocation changes are often associated with the pain faced by investors. When there is financial pain through loses, allocations change, so it is important to know where are the pain points. Pain points can be associated with book value loses. Look at when money flowed into an asset class and the price associated with that flow.

For the current issue, we can look at bond flows each year and the average yield during that year. Assuming an average duration, the total return gain or loss for a given year can be found. Running a simple analysis shows that 2009 and 2013 were difficult years for bond investors, but other periods since the Great Financial Crisis were positive. 

If we look at bond flows, there were no net increases between 2012 and 2016, so most of the investors are still above water on a book value based on when they may have bought their bonds. Simply put, tracking bond flows suggest many new bond investors have not faced enough pain to readjust their portfolios. Rates will have to increase to 2.75% or higher to get the majority of bond flows invested post-crisis to fall below book value. That was the 10-year yield at the end of 2011 when bond flows peaked. The 10-year yield at the end of 2009 and 2010 were both greater than 3%.  

This is a simple analysis, but tries to focus on the key decision of when investors will be sellers. The CFTC commitment of traders provides useful information on market tilts, but speculative traders have a different pain threshold and it is real money account flows that may have a greater impact on yields.

For equities, the flows have been flat since before the Great Financial Crisis. This suggests that the equity markets are less likely to be viewed as being at market extremes. There is little new money that is at risk of falling below book value. Many have not participated in the market upside.

Saturday, February 11, 2017

Contango still dominates the commodity markets


There has been increased interest in commodities and real assets with the increase in inflation. Commodity price as measured by the Bloomberg commodity are off the lows since February of last year, but he markets are still digesting the adjustments in demand and supply since the Great Financial Crisis. Most markets are still in contango because of high inventory levels. These contango levels have fallen over the last year, but are not like the long periods of backwardation during the 90's and commodity super cycle. This places a significant roll drag on performance for pension funds that may choose to buy an index. 


The drag on index performance can be significant. A review of total returns for the GSCI index relative to the GSCI 3-months forward shows the impact of contango. The return drag even in the last year when the index was up close to 20% was just over 1.5%. Over the last year, the drag has been well over 3%. Obviously, if there is a strong index move, the price appreciation may more than offset the drag, but it is a clear cost with trading commodities at this time.


BlackRock Survey - investors will pour into real assets


Earlier this month, BlackRock reported their institutional investor survey findings taken from late last year. The results are not that surprising if you believe that inflation may be rising and there is still a need for yield. Cash levels are expected to decline along with fixed income, but real estate will see a large boost. Investors will reduce public equity exposure, but increase their exposure to private equity. There is a bias to less liquid higher risky assets. What may catch some by surprise is the large increase in allocations to real assets which includes timber, commodities, infrastructure, and farmland.

If you believe that inflation is going to further increase, then the real asset increase make perfect sense as an allocation alternative. Surveys are good at showing the revealed preferences of investors. This is where money will be committed. 

Commodity markets seem to have bottomed last February, but we are only 16% above the lows. The long-term performance is still well below the highs from before the Great Financial Crisis. Farmland prices as reported by three Federal Reserve banks have fallen by about 5% over the last year. Farm prices peaked just after farm income peaked in 2014. This may be a good time for increases in real assets.

Thursday, February 9, 2017

Endowment models - Bogle simplicity a winner


Everyone likes to follow what endowments are doing because there is the assumption that they represent smart money. If universities are where the smart people are, then it stands to reason that their money managers are also smart. The return numbers suggest that endowments don't have a lock on good performance. In fact, simple allocations have proven to be more effective at generating return. The Bogle model which is a simple variation on the classic 60/40 stock/bond mix is a perfect example. This asset allocation in made up of 40% US equities (total US stock index), 20% international equities (total international stock index) and 40% bonds (total bond index). 

The Bogle allocation works when compared with endowment allocations which have been tilted to alternatives and away from equities; however, there are no guarantees to its future success. It may have been lucky, but it is worth, at the least, being used as a straw man for comparison. Endowments are dynamic and have all of the information of market changes at their fingertips. The Bogle model was a static allocation.

This allocation has benefited from the strong stock rally and the rate declines since the Great Financial Crisis, but it serves as a good baseline for future discussion. A simple question can be asked. If you change allocations from this simple approach, are there good reasons to justify the new allocation? An allocator can compare their active shares against this simple model and provide a reason for the change. 

Source information from Ben Carlson and "A Wealth of Finance"

A quick review shows that the Bogle allocation would have been in the top quartile for 3-year and 5-years and the top decile for the last 10-years. Some may argue that the simple model just got lucky and will not represent future performance. There is no question that we may have turned the corner on easy returns in equities and the big bond rally may be over. I may be more biased to the 50/30/20 world of equities/bonds/alternatives, but it is still critical to look at some simple allocations as a base.

Inflation closing in on magic 2% or bouncing back


Current inflation numbers are all moving closer to 2%, but there is no special policy action from hitting or exceeding this rate. In fact, a cautious Fed is more likely with the most aggressive forecast being 2-3 rate moves. The Fed has not followed a mechanistic policy even though they have stated they are "data driven". The most likely forecast will be to fade the earlier musings of the Fed.

It is notable that the PCE index which is the Fed preferred inflation index is still below 2%. The PPI which has a loose link with the CPI but may provide a noisy lead is also below the 2% target. It is the CPI which has moved above the target, yet policy-makers place less weight on its importance. Nominal wages are increasing by just under 4% but this change has fallen over the last year.

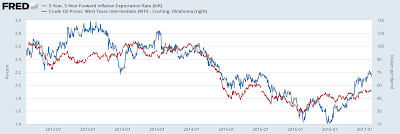
The latest 5-yr 5-yr forward inflation expectations may have temporarily topped, but the variation around this number suggests that this decline is noise at this time. These inflation expectations have moved closely with oil price levels. Expectations moved quickly higher with oil gains in 2016 and have topped with the range-bound behavior in oil.


Increases in inflation expectations may abate with delays in fiscal policy. A slowdown in US federal spending or a delay in a tax cut will likely push inflation and expectations lower. Asset allocation decisions based on higher inflation may not see immediate performance gains. There may be a chance for investors to wait and see how new policies unfold before responding to inflation.


Wednesday, February 8, 2017

Hedge fund performance starts well for January


The markets were generally calm for January even with the upheaval and uncertainty from the new Trump Administration. The surprise for many investors is the continued low volatility in the markets which seems inconsistent with the political uncertainty faced. While hedge funds generally did well for the month, there were some negative stand-outs, the macro and CTA strategies. 

It is generally accepted that these two strategies will not do as well during calm periods, but that does mean that there should be strong under-performance during low volatility periods. These managers were hit with trade reversals from last month's trends and new positions that either did not work or stalled under the low volatility environment.


For the last year, there have been some hedge fund style highlights such as market directional, event driven, distressed, and special situations, but many strategies that did not meet expectations. We have highlighted the under-performance in macro and systematic strategies. We believe they should have done better given the rotation away from fixed income during the year. Nevertheless, there has been consistent underperformance by many managers during these bond sell-offs from an inability to profit from short bond opportunities. Fighting against yield and getting timing right for short positions has been difficult for many of these managers.


Commodity exposure - Off the lows and worth considering


From the high in June 2008, the Bloomberg Commodity index (formerly the DJ-UBS index) is still down from its high by 61.6%. The index is off the all-time lows since the crisis which was reached last February 2016 by about 16.5%, but the index is nowhere near old highs.  

Yet, there are some relative changes going on with cross-asset performance which should cause a closer look. Although commodities have even been the worst performing sector over the last two years, it has seen double-digit gains since the beginning of 2016. Commodities have outperformed bonds over this period and have moved up with equities. Of course, this is the same time when inflation expectations have increased significantly with 5-yr/5-yr forwards showing a gain of close to 50% since their lows last year. 


Asset allocation has to consider not the past but what the futures may hold. Past performance would have led to severe under-weighting of commodities over the last two years, but a more dynamic allocation process which includes momentum would start to increase weightings based on better performance, greater diversification, and factor diversification relative to inflation.

Tuesday, February 7, 2017

What are big endowments doing with their allocations?

This above chart from thetrustedinsight.com provides an interesting tale about asset allocation for large endowments. Forgot about the traditional 60/40 stock/bond mix. Forget about the 50/30/20 stock/bond/alternatives mix. If you don't need liquidity, as is the case for the endowment portfolio allocations, a mix between liquid and illiquid is a better base framework. Hold private equity and real estate as core allocations. This core is for long-term appreciation and cash flow greater than bonds, but is generally illiquid. Take money from fixed income and cash. Take funds from public equities and use hedge funds, which may have mixed liquidity, as an additional return enhancer. The public equity and bond/cash portion of portfolios is between 25 and 50%, while hedge funds are from 7.5 to 32.5% for these key endowments. The majority of their allocations are not with traditional equity and bond beta.

Making a generalization, the new endowment allocation is 35/45/20 or 35% liquid beta, 45% illiquid investments, and 20% alpha. Of course, you can come up with other descriptors given the chart numbers but we are looking for some simple commonality on the asset allocation.

First, if you don't need the liquidity find investments that you will get paid a premium for taking on illiquidity. Second, look for alpha or return enhancements where you can find them. Hedge funds can be alpha enhancers and substitutes for fixed income or beta. Third, cut your public beta exposure or at least change it to more illiquid investments that can give more beta per dollar invested. Most private equity will be at higher market beta or credit beta.

This endowment liquidity sensitive approach is not for everyone. You have to be able to sit on investments for long periods without a need for cash and you have to have skill to find the alpha enhancers or private investment managers. Yet, it is worth thinking about how these portfolios can be replicated in a different more accessible form.