Thursday, January 31, 2013

2013 investment themes

  • The theme of austerity versus fiscal deficits will be a key driver of markets. However, following the the news flow will not be rewarded in the longer run. Markets are moving because of changes in growth. The austerity or fiscal deficit issue will only effect markets if there is a surprise that translates into a change in growth. The most important theme is that credit headwinds will continue to cut growth rates.
  • Three speed global economy (from Barclay's) - There will be fast growth in China, slow growth in the US, and negative growth in Europe. This is likely to be the growth theme for 2013 even with a negative print for the fourth quarter in the US of -.1%.
  • The new Japan - The declining yen will have a positive impact on exports and on the Japanese stock market. It has been a long time since Japan has been relevant for world growth in a positive way.
  • A calmer Europe - While the EU is in recession, we have seen a calmer Europe in the second half of 2012 and this will continue for 2013. This does not change the underlying negative structural problems, but there will be less headline risk.
  • The new China growth story - China will move to increased internal spending as a consumer society but it will not be at the pace that will solve other world growth problems. Structural problems exist in banking, state enterprise, labor markets, and the rural to urban migration. These have not really been addressed since the government change in the fall. 
  • There is the constant of hope versus fear - The hope that we will go back to a normal recovery versus the fear that we will be stuck in slow growth.
  • The growing importance of emerging markets  - We will not go back to the old world of developed markets being a driver and big swings in emerging market performance.
  • Type 2 stagnation - Relative economic stagnation with asset price inflation not goods inflation
  • The paradox of taxes - Regulation and cost inflation will be on a rise with poor growth deflation. Higher prices not coming form higher demand. Taxes will slow growth and drive prices higher. 


Low information voters (investors) drive markets

Low information voters (LIV) have become part of of our political lexicon, but the same concept could be used as an explanation on what drives asset markets. Those markets which have more LII (Low Information Investors) will have a higher likelihood of moving away from fair value and be less driven by the fundamentals. If you think about markets as a voting mechanism this analogy is apt. When we see markets move for reasons unrelated to fundamentals, we can confidently say they are driven by LII. This is just another way of saying "noise" traders which was the term used in the 1980's.

A good example would be the gold market which is often moved by ETF flows and not fundamentals. The low information investors who are driven by headline risk are another example where there can be a deviations from fundamentals by those who do not do their homework. LII can lead to market prices or results that seem out of touch with reality no different than the impact LIV some elections.

Tuesday, January 29, 2013

Yen and currency wars

The yen continues its march lower based on the expectation that the BOJ will get serious about a 2% inflation target. The market has been expecting this for years, but this seems like the first time that the government and central bank will be coordinated with policy. Of course, the BOJ has had little say about their independence given the strong tactics of the new government to announce the new monetary policy and back it up with a change in personnel.  

Abenomics is going to be in place to jump-start the Japanese economy. Some have started to comment about a new currency war, but the Japanese economic minister states that this is not currency manipulation but a result of  change in policy to hit the higher inflation target. Rightly so, there has not been active intervention but a change in policy, and a clear change in monetary policy will affect exchange rates. Rational expectations tell us this is the outcome. The Japanese government states that the falling yen is just the results of market economics. 

This new policy is a double edged sword. One the one hand, world governments have been pushing for action by the Japanese government to inflate the economy, yet now that it is happening there are some who say that the currency is being manipulated for the advantage of the Japanese. You cannot have it both ways. The currency war is now about what exactly the rest of the world would like from Japan.

Monday, January 28, 2013

The power of the Mississippi River


The Mississippi River has been at extremely low levels which has been affecting the logistics of grain markets. Barge traffic has slowed and getting corn, wheat or soybeans down river for exports has slowed and become more expensive. Logistics and transportation is  a key part of the commodity story. The chart shows the fluctuations of the river level over time. We are at lows but this is a normal part of the dynamics of a river. 

I have also enclosed a map from the geological survey done by Harold Fisk and his team decades ago. It shows how the Mississippi has changed directions and course over time. It is truly a beautiful map with an amazing amount of information. Nature has a way of determining its own course. Commodity trading is always about learning that lesson.

Thursday, January 24, 2013

ExxonMobil energy outlook 2040


ExxonMobil has presented its new forecast for energy markets for the year 2040, The Outlook for Energy: A View to 2040. This is an interesting read regardless how much stock you place on long-term forecasts. This works sets the direction for the entire oil industry. There are a number of clear themes from this forecast which should affect all in the energy markets.

First, there will not be significant demand increases from the OECD countries because there will be continued significant increases in energy efficiency. The developed world will produce more with less. Second, as a result, there will be a significant shift in energy demand to the non-OECD countries. The emerging markets will be the were all the demand increases will be coming from. The whole energy market will shift to Asia. Third, the world will move to become more natural gas driven. Finally, trade flows will change with the new pattern of demand.

Think of the significant change in capital flows and logistics over the next decade. Refining and infrastructure will be focused in Asia. Tanker flow will be toward Asia. Trading of oil will move away from North America and into the Asian time zone. The Asian countries will have more interest in the geopolitical developments in the Middle East. The US will become more oil independent and may actually be an exporter  of natural gas. Capital will also be needed for more infrastructure developments in electricity. More urbanization will lead to greater electricity demand. A global system that has focused on OECD growth will now have to shift to emerging markets. 

Where is the new oil supply going to come from?


Oil is expected to be the slowest-growing fuel over the next 20 years. Overall growth in supply – by 9.5 Mb/d in 2010-20, or by 11%.

Rising supply should come primarily from OPEC, where output is projected to rise by 5.8 Mb/d. The largest increments of new OPEC supply will come from NGLs, as well as conventional crude in Iraq.

Non-OPEC supply will rise due primarily to strong growth in the Americas -- from US and Brazilian biofuels, Canadian oil sands, Brazilian deepwater, and US shale oil (which combined provide growth of about 4.5 Mb/d). The US and Brazil contribute almost 75% to the global growth in biofuels production over the decade.

Outside OPEC and non-conventional production growth in Americas, we expect the rest of non-OPEC to see a decline in production by 0.8 Mb/d; without growth in non-OPEC biofuel this decline amounts to ~1Mb/d.

This overall decline would be a combination of rather different trends across the non-OPEC world: a significant decline in Europe (-1.5 Mb/d), a steady expansion in FSU (+0.9 Mb/d), and smaller changes in Asia Pacific (-0.3) and non-OPEC Africa (+0.2). 

- BP estimates

The world will still be dependent on OPEC and in particular the growth of Iraqi oil production. The US may gain more independence but the rest of the world will be concerned about matters in the Middle East.  

Optionality and betting on corn


Why is there is high optionality with holding agricultural commodities? There is a high cost of stop-out if you are user of these commodities. This is more likely if there is a low stock to usage ratio. Using the simple scenario presented above, it can easily be seen that even if there is a record harvest, the ending stocks will be below the long-term average. If we have a harvest this year that is close to the ten-year average there will be ending stocks below average.

Even if we have an average or better than average, we will still end with a tight supply situation; consequently, there is a reason to hoard what is available. Prices will have to rise to dislodge hoarding and reduce demand. If there is more demand rationing and better future supply, prices will have to come down in the future. This will cause the forward curve to be in backwardation. Users will want to have the optionality to prepare for the worst, hence there will be a willingness to pay higher for the cash commodity.

Wednesday, January 23, 2013

The question of corn demand


Forecasts on the direction of corn prices is based on both supply and demand analysis and currently there is a high degree of uncertainty about the direction of both components. 

On the supply side, uncertainty will be resolved once we have a better idea on the planting intention of farmers in the Midwest. This is the same process of uncertainty resolution that the market faces every year. There is nothing unusual here. The early expectation is that this will be another year of record acreage. 

The problem area is determining demand. The demand equation is driven by three factors, ethanol, feed, and exports. 

The export market is driven by relative prices against alternative corn growers. Here the focus has to be on the price of South American corn. 

For ethanol, the focus has to be on gasoline prices. Given the still strong gasoline markets, ethanol has not be as responsive to the gains in corn prices. Ethanol prices are below RBOB futures prices which means there is gross positive spread on ethanol production. Ethanol production is expected to increase this year after lower gains the last two years. Capacity for ethanol production has doubled in the last five years but is now showing rationalization as new investments in this energy sector has dwindled. Ethanol production is hitting saturation with US gasoline using 10% ethanol blend or E10 gas. New ethanol demand will have to come from higher gasoline usage when the saturation point is hit. The information on earnings is also less attractive which has affected the return opportunities in this sector. There should be a pullback in demand from this sector, but ethanol firms have increased productivity; consequently, it is not easy to say how demand rationing will affect this key market sector.

Feed and residual has not shown the rationing that was expected in the last two quarters. Livestock herds have declined but the demand for feed has not followed expectations and declined as much as expected. Hence, overall demand is stronger than expected which places a constraint on any price decline.

Monday, January 21, 2013

Tax or deficit choice - the lesser evil?


“strongly suggest that the latest fiscal policy actions will serve to further restrain economic growth. We cannot tax ourselves into prosperity ... We can, however, deficit spend ourselves into poverty.”

In their fourth-quarter 2012 Quarterly Review and Outlook – today’s OTB – Lacy Hunt and Van Hoisington spell out the consequences of the so-called American Taxpayer Relief Act 

-from John Mauldin 

A very good way to put the current policy choice issue within the context of macroeconomics. It is hard to say why so many are optimistic.

Lacy and Van also present another interesting piece of analysis. We still have close to 2% inflation but there is still slack in the economy. 

To be sure, prices of many items are rising, partially due to legislative changes in taxes, fees, regulation, compliance costs, medical mandates and other non-market forces. However, competition in the marketplace has created downward pressure on market driven prices. Thus, we have an unusual paradox whereby legislative and regulatory changes elevate the cost of living, yet with this inflation, there is no associated growth in income and standards of living decline. In this circumstance, real income falters, and purchases of non-mandated and discretionary items decline in value and price. Call it “the deflationary paradox of legislated increases in the cost of living.”


Thursday, January 17, 2013

Value from holding back-month futures


We undertook a simple exercise with the DJUBS total return commodity index. We compared the total return for the 3-month forward versus the 1-month forward. This difference will capture the impact of the forward curve on the commodity index. The  chart shows the total return difference since 2000 and the ratio of the two total return series. 

If the markets are in backwardation, then the F1 index will be greater than the F3 index. If the ratio declines then the F1 is doing better than the F3 and suggests that an investor would be better served to hold the nearby futures basket. During the period when commodities had their greatest increases, the markets were generally in backwardation and showed better F1 performance. This changed after the 2006 when the F3 index did better. Over the last 2-3 years performance differences have been flat and more recently, the front-month F1 contract actually showed better performance. The forward curves for the index are dynamic and it is not always the case that an investor should be either in the front or the back of the forward curve.

Tuesday, January 15, 2013

Otis Webb Brawley's maxim for investments


Otis Webb Brawley's How We Do Harm: A Doctor Breaks Ranks About Being Sick in America  gives an account of his Jesuit education and the important lesson of Father Richard Polakowski, a beloved high school teacher at the University of Detroit Jesuit High School.  "Polo," as the students called him, "had a maxim that no student who took his class could miss: 'Say what you know, what you don't know, and what you believe--and label it accordingly.'"
Use your intellect, gentlemen. Start with knowledge, find its boundary. DO not stop! Save room for belief, but examine it fearlessly, for genuine examination knows no limitation. 

Good advice for any investment professional. 

Sunday, January 13, 2013

Surprising research on dishonesty -


Washington, Wall Street, and most we meet in everyday life cheat, yet we really have not spent a lot of time research why we are dishonest. Finding the truthful man is not going to be easy and we do not have a good understanding why. This has changed with Dan Ariely's insightful book The Honest Truth About Dishonesty. This is a book that will truly change your mind on a lot of moral issues. I cannot remember the last time there was so much research that I found surprising to my conventional views as an economist.

As an economist who has been strongly influenced by the work of Gary Becker, cheating is just a rational problem of cost/benefit analysis. People cheat because they look at the cost of being punished times the probability of being caught versus the potential gain.  You find the expected value of the cost and then determine if the benefit is worthy of the risk. Students cheat because of the gain of a grade. Businesses cheat for profit. People deal drugs because the profit is grader than the cost of going to jail. Life is  simple. Dan Ariely shows again and again that the rational standard model of cost benefit analysis does not work. We cheat all of the time regardless of the benefit or the chance of getting caught. Of course, when the cost is very low, we cheat more, but there is much more going on with our behavior.

Everyone cheats but just a little; however, the degree of cheating is measurable even though it does not fit the rational model. Ariely has tested in a very systematic manner the environment whereby people will cheat more or be more honest. Using very strong controlled measures in a lab, he can can make some definitive statements on honesty. There are actions that can make us more honest, but again they do not fit the simple rational model. Temptation is real, so action has to taken to reduce the environment for temptation even though this is usually not just increasing penalties. The implications for eduction, regulation, and management are very strong. This is a must read for just about every group I know.

Friday, January 11, 2013

Trillion dollar coin - where are we going?

It is the end of the week and the fact that some are thinking about a trillion dollar coin as a solution to the debt ceiling makes one wonder where we are really going with debt discussions. Without a complete review, the issue is very simple. The US Treasury has the ability to mint coins in any denomination. The trillion coin is booked at the Fed and the funds are transferred to the Treasury. After the debt limit is raised the Treasury will sell bonds and then take the proceed to buy back the trillion dollar coin in exchange for Treasury debt. The Treasury acts this way now if there are new coins minted.

If there is a constraint on the amount of debt that can be issued and held by the public, then you have to monetize your liabilities through some other method. If you can go directly to the central bank and have them issue dollars, then you can pay bills with the fresh dollars. The dollar liabilities from the central bank is offset by holding a trillion dollar coin as an asset. The accounting works, but you will be deflating the currency.Talk about monetizing the debt!

The debt ceiling has to be raised to allow for new debt, but it does not seem unreasonable to ask for some spending constraints in exchange for allow a debt hike. Sure this debt ceiling level can be viewed as pure fiction, but it provides some means to constrain on spending.

Postive contagion - is that a bubble?

We spoke a lot about contagion when things go poorly but I believe there is a positive contagion when things go well. And I think that’s also what is in play now. There is a positive contagion.”

ECB President Draghi

Contagion has always been thought of as a negative to the market. Certainly we think of a medical contagion as an epidemic. If there is a positive contagion that could be thought of as a bubble. It could be a herd mentality. It is unclear that we want to base a recovery on any contagion but on an positive growth environment.  

Thursday, January 10, 2013

Oil and geopolitics

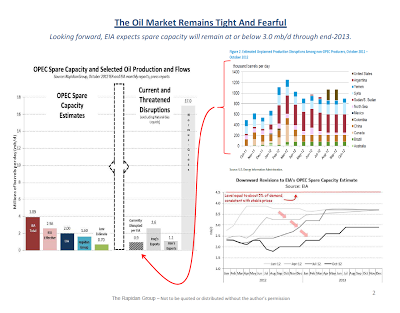
The recent oil price increases  are more likely associated with strengthen of economic growth. Oil prices are moving higher even though there is no obvious geopolitical risk. Nevertheless, geopolitical risks are always hanging over thee oil market.

A significant portion of option demand in the oil market is driven geopolitical risks. Geopolitical risks can be tempered by the current conditions of the oil market. One of these key structural issues is the level of over capacity in the market. If there is limited overcapacity, any disruption will lead to a greater market move because oil will just not be available. If there is more overcapacity around the world, an oil price shock can be dampened.Supply will be forthcoming form new sources if those are located away from the shock. A second structural issue is the amount of inventory held in storage. Low inventory will mean a strong price reaction to any shock. This is consistent with any stock/usage model of commodities.

Right now there has been a decline in capacity to something below 3 mb/d. Estimates suggest that 4.5 mb/d would represent about 5% of global demand. If there is a shock, there will be a strong market reaction. Hence, it makes sense to buy out of the money calls under threat of a geopolitical shock.

Robert McNally from the Rapidan Group presented some informative charts at the Morgan Stanley Miami Commodities Conference.

Wednesday, January 9, 2013

Scaling risk and behavior - real versus perceived risks


 An informative graph from CheckRisk LLP. Our perceive risks are often highest at those points when the market and real risks are low. When real risks are highest, perceived risk may be low because gains have been made. Return to risk is dynamic and needs to be used as part of the normal investment calculus.

Looking into the past- do not use the rear-view mirror


Don't always look into the rear-view mirror for your forecast. When you do that you cannot move forward without huge risks. History is valuable, but you cannot always look to the past for all of the answers. You need to adapt to current circumstances which may never have occurred.

Sunday, January 6, 2013

Oversupply in commodities?

Commodities had a flat year for 2012 and now we are seeing articles on the potential oversupply in some markets. Unfortunately, many of these stories are based on a superficial reading of the market dynamics. The key to understanding commodity indices is that they not behave like the indices found in equities or fixed income. The correlations across commodity markets are significantly less than that found in other asset classes. This means that it is not effective to talk about general oversupply. There will be common swings in commodities based on macroeconomic factors that will affect demand but effective commodity investing has to look at individual markets.

There can be over-supply in some commodity markets but that does not tell us anything about the dynamics of oversupply across all commodity markets. A case in point is when we look at the dynamics in the agriculture markets. There are clear issues of potential shortages within the row crops. The stock to usage in wheat, corn, and soybeans all look like there can be significant increases in price if there is another poor harvest in these markets. However, if we look at coffee, cocoa, cotton, and sugar, the markets look significantly different. Here there is an issue of oversupply which depressed prices. One sector, but two very different world view on supply and demand. The agriculture sector saw a significant gain in 2012 based on the Midwest drought but looking at the sector overall will tell a more muted story. 

In the energy markets, there is no issue of under supply. For oil, the inventories in the US are strong. In natural gas the supply is still biased to excess from shale discoveries. Profit margins for refiners are strong. Hence, there is strong production of refined products. Metals mining has still been profitable so supply is available in the markets. However, the expectation is that production will slow with falling demand.

The key to commodity markets which have better supply conditions will be demand factors as displayed by global growth. Growth will be the driver of energy and metals markets while weather will again be the driver in agriculture markets. These are not wild predictions because the history of business and commodity cycles would give the same answer. It is usually best to fall back on history as the guide for commodity direction. 

OODA for the New Year


OODA is the acronym that was developed by the Air Force to help with combat decision-making. Observe, Orient, Decide, Act. It may have fallen out of favor as a basis for decision-making because it is now close to 50 years old. We have moved away form this process driven decision framework, yet it may still serve as a key to effective decision-making in our current uncertain world. The key to OODA is that try and get inside the thought process of your opponent and better anticipate future actions. In the case of the market, we have to try and anticipate actions through thoughtful observation and placing the information gathered in the right context. 

Success is not always trying to forecast the future, but observing whether it is raining today which matters. OODA calls for continual adaption, and the complexities of the market for 2013 will call for swift adjustments as policies change quickly in order to get immediate results. Focus on OODA for the new year. 

Wait - a muddle of good ideas, think about it


Frank Partnoy provides many useful stories on the need to wait on decision-making, but the case for waiting is not overly convincing. Working fast has benefits. If you gather information faster, then you have more time for analysis, but that is not the same as gathering all information and then delaying action. Waiting under the view that something better may be learned by not deciding, is not an appropriate action.

 He starts with the idea that quick reflexes in some sports allows for more time to make a decision. This is not the same as waiting. Poor reflexes does not allow any time for a decision. The action passes you by. This is not the same as waiting. He discusses comic timing and the power of delay. The book has a chapter on wait time for apologies. Procrastination is tool to sort through what is important. The process of discounting is very complex for humans and we generally have a problem with short-term gratification delay. Innovation takes time and not usually associated with one moment of inspiration. Interesting, but not strong enough to use as a base for decision-making.

Partnoy wants to make the argument that if you are not sure what to do, it may be better to do nothing. Don't just do something, sit there! His argument is not well developed once he moves beyond the neurobiology research of fast reaction.

There are strong argument to react fast as well as slow.  He makes the argument that we have hidden biases that will be used if we react too fats. Here he is on firmer ground in arguing that we have to delay to think about our decisions and avoid unconscious biases. This delay will avoid making rash judgments through "thin-slicing". Pattern recognition is generally effective,  but there will be biases that can lead to wrong judgments. The power of the OODA (Observe, Orient, Decide, and Act) decision paradigm should not be confused as a basis for waiting as a paradigm. Thinking is critical and if you slowdown, you can think through options. The premium is on thought not waiting.    

Best business book of 2012 - Nate Silver The Signal and the Noise


The most thoughtful book for business in 2012 was The Signal and The Noise: Why so Many Predictions fail - but Some Don't  by Nate Silver. It is on the shortlist by many, so I will not do a full review. Rather I will focus on a broad overview. Forecasting is hard. The accuracy of many is poor, but there are things you can do to be better at making predictions. Being a skeptic about forecasting does not mean that the process should not be undertaken. 

Simply put, there is a difference between forecasts and predictions. We want to improve forecast but avoid predictions. We have more data available so we should use it to provide more accurate forecasts of what is probable, yet we have to be careful about generating predictions which are likely to be wrong. Experts are not always more accurate. Be a fox and see things broadly. Do not be a hedgehog and focuses too closely in one area. Watch for biases. Think probabilistically. Use Bayes Theorem. Understand the crowd and look for consensus. Weigh qualitative as well as quantitative data. Be a skeptic. Within a signal there will be noise. Silver provides good advice in an uncertain world. 

Forecasting for the new year - think Schelling

"There is a tendency in our planning to confuse the unfamiliar with the improbable. The contingency we have not considered seriously looks strange; what looks strange is thought improbable; what is improbable need not be considered seriously."

- Thomas Schelling foreword in Roberta Wohlsteller Pearl Harbor: Warning and Decision

It does not make sense to come up with wild speculation on different market scenarios, but it does make sense to think and plan for those actions which are less likely. Determine what is normal and then think about deviations from the norm. We should expect a slowdown in 2013 given the austerity of governments. Hence, the focus should be on what would happen if that is not the case. 

Ken Fisher and common sense


Ken Fisher's new book provides some simple common sense ideas for investing. Remember the past because it is likely to repeat or at least provide insight on where we are heading. The idea that "this time is different" is simply wrong. History does repeat itself, but with slight variation, so our job is not to accept that we are in a different environment but decipher what is new relative to what is like the past. Do your homework and do not believe the headlines. 

Fisher provides some interesting example of how we think the current environment is different but it is actually just a repeat of the past. He uses past headlines to show how we have been there before. For example, the the idea that we are in a "new normal" is old. We can go back decades and read financial writers exclaim that we are in a new normal. Th same argument applies to a "jobless recovery". All recoveries are initially jobless because job growth turns later in the business cycle. That is the history of business cycles. Moaning about the jobless recovery initially makes no sense in historical context. There could be a jobs problem, but it has to be in the context of what is normal. The talk of a double dip recession has occurred with many recessions. This is not a new fear. Our understanding of the link between history and reality is faulty.

The same can be said about ideas concerning average return with stock indices. Bull markets are inherently above average and you get a V-bounce with recoveries. This happened again after this recession. There should not be a worry that the markets are getting ahead of themselves given that this is inherent with most of history during recoveries. The arguments that the markets move too far or too fast during a recovery are misplaced since all have to be above average returns. 

Volatility within a trend is normal. You can have a recovery but still see variation in market returns and in economic data. The markets are usually never dull. Accept that markets and the world is always changing. Fisher presents a table on big events every year since 1934. There was a lot of uncertainty going on even with markets moving higher. Bear markets do occur but the downside risk over the long-run is still relatively low when you account for dividends as well as price change. The talk of a lost decade for stocks in 2009 and 2010 was misplaced. 

There may be a debt problem but discussions concerning an over-indebted consumer have been had for decades. Less debt may be better but  a debt free world is worse. Like anything, too much is a problem.

This is a fast read but a thoughtful set of arguments that history has something to teach us. 

Friday, January 4, 2013

Equal weights have value in commodities

One of the easiest ways to beat an index is to use diversification in your favor. The value of diversification increases with the decline in correlation across markets. When there is lower correlation, having more equal weighting will be valuable to a portfolio. A simple case is looking at the equal weighted Rogers Commodities index RICI versus an equal weighted portfolio. The RICI is the most diversified commodity index and commodities generally have lower correlation than equities. Even in this case, there is value with holding an equal weighted portfolio. 

If you do not have a forecasting edge, the easiest way to sleep at night is to take the 1/N rule. Equal weight and go home. You will do well in the long-run.

Commodity volatility at 10 year lows


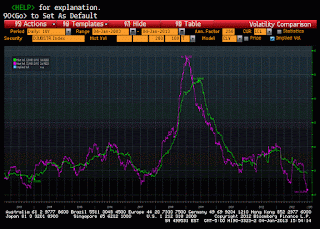
Commodity volatility has fallen off a cliff and is now at 10 year lows based on 100-day moving averages. The 200-day moving averages are also close to the lows reached in 2003. There was no volatility increases from the fiscal cliff. There was no increase from the EU sovereign events of 2012.  We are at 1/3rd the volatility in late 2008 and early 2009. 

Even with the shortages in agriculture from the drought the overall index has been on continued down-trend. Agriculture volatility has stabilized at a higher level than found in the 2003-07 period. Energy volatility has continued to stay low for the last 30 months. Precious metals volatility has declined through the year and is below the 10-year averages. The same trend applies to industrial metals. The world has been a calm place for commodities and it is not clear what will change this trend.

BOJ holds the fate of Japan

After years of deflation, Japan may be in a place where they are willing to accept inflation to help stimulate the economy. Deflationary expectations have been a part of the Japanese mind-set for years. The Japanese have now picked a Prime Minister, Abe, who is going to do everything in his power to raise inflation and get the economy moving. 

Third quarter real GDP is up only .5% . Nominal GDP was down -.3 percent. The GDP deflator was down -.8 and has been negative every quarter since 2009:q3. Except for 2009, every quarter for a decade has been seen a negative GDP deflator. There was not resolve to raise prices.  There was a period of positive GDP deflator numbers in 1997-98 but 20 years of data shows only 7quaters out of 80 which were zero or positive.

The BOJ has the control of money and it has to use the unconventional means discussed by Ben Bernanke to get inflation higher and the yen lower. Just the thought of change has seen a 10 point decline of the yen since October from 78 to 88. Now, there has to be concrete monetary action to further this trend. Here is a special case where getting prices higher and hurting wealth holders may be for their own good. Of course, the rest of the G7 may be thinking about similar plans.

The year of the butterfly in currencies


The currency markets 2012 can be viewed as the year of the butterfly. A look at the performance of the DXY dollar index showed relatively flat performance for the first four month and flat performance in the last quarter which represented the wings. The middle of the year was marked by a flight to the dollar in response to renewed problems with Euro-zone crisis. The dollar reversed this strengthened on the renewed commitment of the ECB President Draghi to do whatever it takes to provide liquidity to the bond markets. An expectation that Fed Chairman Bernanke would actively extend monetary easing through a QE3 also brought the dollar back down to its ranges seen earlier in the year. For currencies, this was the classic risk-on and risk-off with the dollar rallying on sovereign risk only to reverse once policy-makers offered a liquidity solution.  

 Our butterfly pattern would have made the “Rip Van Winkle” test or “Sleep-Test” operative. An investor who went to sleep at the beginning of 2012 would not have noted a significant change in dollar performance when they woke-up at the end of the year. The exception to this relative stability year over year was the significant sell-off in the yen which has hit 28 month lows. Here, someone would have awakened to a new yen world.