Thursday, June 27, 2019

An Animal Kingdom of Different Risks - White Leopards, Grey Rhinos, and Black Swans

Most investors have heard about Black Swans over last decade. Now we have investors seeing Black Swans all over the market, but there are others in the animal kingdom that may be as dangerous. I refer to Grey Rhinos and White Leopards. These risk animals are more likely to be encountered than a Black Swan. Nevertheless, some of these other animal metaphors can be better controlled than a Black Swan. First, let's define some of the animals in the risk kingdom. 

Black Swans are unknown events that are not obvious to most investors. Their very trouble comes from the fact that they are unknown unknowns that can have a sizable impact on an investment portfolio. By definition, you cannot predict or handicap these events although you know that they are possible. 

Grey Rhinos are a very different beast. They are big and obvious. You will see them coming but often we choose to ignore the risks they represent. We under estimate their size and their speed. You may not think they are close, but with a running speed of close to 40 mph, a Grey Rhino can be next to you before you know it.  

The White Leopard is a stealthy creature that stays hidden through effective camouflage. Its risk is out in the market wilderness. You know it exists but it remains hidden until it is almost too late. It is not a true unknown, but something that could be in plain sight if only you knew how to identify the risk.

For Black Swans, the strategy is to maximize diversification to protect from the unexpected. The other alternative often discussed for dealing with Black Swans is a barbell strategy of holding limited risk that you can lose and use the rest of the assets for principal protection. For Grey Rhinos, you have to act on these obvious risks and tilt exposures away from these potential problems before they arise. The White Leopards require more work. These risks are not obvious but they are only a surprise if you are not prepared. Think of all of the investment fraud cases as clear examples. The risks were present just hidden from those not looking for them. If an investor does not do his homework, he will be subject to surprises from ignorance.

The zoo can be expanded but there are some simple dangerous risk animals. A simple review of the current investment world suggests that we can face all three of the animals described. There is the Grey Rhino of the credit markets. There are the White Leopards associated with some of the fund surprises we are seeing in Europe with illiquid assets, and there are the potential geopolitical surprises that can hit at any time like a Black Swan. An investor going out in the investment jungle needs to be prepared for almost anything on their journey. 


Tuesday, June 25, 2019

Investors gain convexity with trend-following but not with other hedge fund strategies


Investors have measured partial correlation to look at the risk impact when markets decline. They have used the term crisis alpha to describe the change in downside correlation for styles like trend-following. These statistics are all descriptions of what investors really want - convexity. The bending of beta under different regimes or market behavior is critical to successful diversification and portfolio performance, so investors should study style convexity. 

My friend Artur Sepp of QuanticaCapital AG has done some interesting work on this topic. He presents some of his research results in a speech, "Convexity of Trend-Following Strategies" at the QuantMinds conference, May 2019. He does a good job of showing the relative value of trend-following versus other hedge fund strategies. It is the only strategy that shows positive beta in up markets and negative beta in down markets.

Sepp breaks-up equity markets into three regimes, bear, normal, and bull and uses conditional regression to measure differences in beta. He finds that there is strong convexity for some strategies and not for others. This convexity appears when we looker over longer holding periods like a quarter. However, there is a cost with buying convexity in that Sharpe ratios are lower for those strategies that exhibit this behavior. Or, those strategies that have higher beta in bear markets need compensation in the form of higher Sharpe ratios. Convex strategies also are related to return skew. Higher Sharpe ratios are associated with negative skew.


Partial correlations and conditional betas are not hard to measure and add an important dimension to portfolio construction. These concepts have been known for some time, but conducting an analysis across the set of hedge fund styles adds context to this discussion and truly shows the trade-offs with investment choices. The positive convexity feature of trend-following does not change the fact that performance over the last few years has been difficult for this strategy; nevertheless, it is important to know key return dynamics. 

Thursday, June 20, 2019

Times series versus cross-sectional momentum - History is on the side of just following winners, trend-following


There have been some managers who have started to say that trend-following is dead. These pronouncements have always occurred when performance has been down or lackluster. Yet, history tells a different story. Yes, there are time when momentum works and when it does not, but the long-run is on the side of the trend-follower and momentum strategies. Perhaps there have been market changes. There will always be market change, but consistency has always been a key advantage for the trend-follower. 

The extensively researched paper, "The Enduring Effect of Time-Series Momentum on Stock Returns over nearly 100-Years" by Ian D’Souza, Voraphat Srichanachaichok, George Wang, and Yaqiong Yao, does a great job of sifting through many combinations and alternatives to reach some well-documented conclusions. While this work is a few years old, it makes a good case for simple time series momentum modeling. The odds are still in your favor by following price action.  

The choices for using price momentum are simple. A time series momentum approach will focus on some look-back return period and buy stocks that have had positive returns and sell those that have had negative returns. The cross-sectional approach will rank order all of the returns for a specific time period and buy the top performing and sell the bottom performing stocks regardless of whether the returns are positive or negative. Both momentum choices can be market neutral with longs matching shorts. 

After looking at decades of stock information both in the US and around the globe, the researchers were able to generate some strong conclusions.
  • Times series momentum performs well over the long run as measured in decades. There has been a fall-off in performance over the last two decades, but the overall results are still positive for momentum strategies.  
  • Times series momentum will do better than cross-sectional momentum and can capture cross-sectional stock momentum return patterns while cross-sectional does not seem to capture the time series effects.
  • Cross-sectional momentum does well in up markets, but time series does well in both up and down markets. Cross-sectional models have a seasonal effect in January while time series does not. 
  • The time series models cannot be explained by conventional factors like Fama-French. The time series momentum is not a proxy for some other risk premium.
  • The data supports the under-reaction hypothesis for why time series modeling is effective. The data do not support an over-reaction hypothesis for momentum. The data also support the "frog-in-the-pan" hypothesis that the slow diffusion of information leads to time series momentum. Discrete information shocks do not lead to price trends. This suggests that small cap stocks with smaller analyst following and the slow dissemination of information will do better with momentum strategies.
  • The researchers also found that blending time series and cross-sectional approaches will do best of all. In this case, rank order performance, but only take positive returns for the long side and negative performers for the short exposure.


This work is consistent with other research posted on this blog that shows that trend-following is superior to momentum (See my blog's futures trading and alternative risk premia categories.) Under-reaction and the slow dissemination which likely leads to positive autocorrelation can be picked up through trends and momentum. Investors can increase their odds of success through focusing on market segments that are less followed and less likely to have discrete jumps in new information.

My take-away for all portfolio decisions no matter what asset class is very straightforward; never forget to look at trends and momentum. You can use fundamentals or other criteria for decision-making, but measure your actions against the price trends. Think of your actions based on the price priors. If prices are moving higher, the bar is set higher for taking action against the trend. If price momentum is falling, buying should always be done with caution. If you are not strongly informed or skilled with fundamentals just focus on the times series. 

Low volatility / Low beta performance - This smart beta edge has been real

Investors are currently in a constant search for defensive investments that can generate strong returns similar to equity benchmarks and provide protection if there is a negative equity environment. Most investment choices cannot provide both. Uncorrelated assets by their nature cannot have the same profile as equity benchmarks, so investors have often focused on choices that will give some downside protection but will have good performance tracking with benchmarks.  

The idea of holding low volatility/low beta portfolios has been a defensive choice that has attracted significantly flows and investor attention. The idea is based on an anomaly that low volatility/beta portfolios actually generate higher returns than higher beta portfolios. Higher risk is not compensated with higher returns. This does sound like a free lunch for investors. 

There are a number of arguments for why low volatility portfolios may outperform higher risk portfolios. It is based on the structural idea that investors either do not use or cannot obtain leverage and thus bid up prices for riskier assets. 

Some researchers suggest that this is not a unique factor and the low volatility anomaly could easily be an issue of mispricing. A mispricing issue means that as more money flows into these strategies there will be less opportunity for gain. If the low volatility is related to other factors, then investors are just not getting what they thought. Ongoing research is still needed on this topic but the empirical results are consistent. Low volatility or minimum volatility portfolios do better than their established benchmarks across, time, geography, and sectors. It does not work all of the time but the low volatility does add value during turbulent equity periods. 

A review of some of the leading smart beta low volatility/beta ETFs by size shows that it has been a reasonable strategy that has done well when equity markets have sold-off as well as performing well through time and across different asset class types. The value of low volatility exposure should not be dismissed as a fad.


Low volatility coupled with lower correlated defensive strategies may form a nice combination of choices for investors. A combination of low volatility with managed futures, for example, will allow for close performance with benchmarks in up markets and more protection in down markets. We will show this impact in future blog posts.

Tuesday, June 18, 2019

Factor portfolio construction - All alternative risk premia are not the same


An investor could say, "I would like to have exposure to risk premium X." However, there is no one single definition or consensus for how to implement a risk premia portfolio. First, there has to be agreement on what it means to say you want a specific factor exposure. There may be agreement from an academic definition, but once you start getting into the investment details, there can be a lot of differences in how to access this premium. 

Here are some of the choice issues for investing in a risk premium:
  • Universe for application of the risk premia. This universe could be, in the case of equities, a large cap set of stocks or a much broader universe which includes mid and small cap stocks. There also has to be the decision whether to include global equities and emerging markets.
  • Monthly or daily reset or rebalancing. The timing for when to rebalance will matter both for performance, risk, and costs.
  • Long-only or some variation of short exposure with constraints. Performance will differ markedly when you include short positions.
  • A pure factor exposure or controlling exposure to other factors matter because over-exposure to one factor may be driven by other risks.
  • Equal weighted, risk weighted, or cap-weighted allocations will impact risk exposures. 
  • Constrained or unconstrained with respect to tracking error or exposures will impact concentration risks. 
The construction issues are relevant for all asset classes. A recent thought piece from the Axioma Group examined one risk factor, profitability, and compared the return results using different portfolio assumptions. The range of performance and correlations are startling. (See "What exactly is a factor? How factor portfolio construction impacts exposures, returns and attributions" from Axioma)

Table 1 shows the definitions for the choice set analyzed. Table 2 shows that the correlations between the factor and different implementation strategies can vary between .83 and .21 over a thirteen-year period. You may not get what you think you paid for with this risk premium.


The performance differences are significant with a spread in the cumulative gain of over 50 percent. The scaled performance differences are over 15 percent. Now, on an annual basis this may only a little more than 1 percent, but these differences add up.  The weighting scheme will also generate significant differences both in the short and long-term. if you made the "wrong" weighting choice, you would have likely exited this risk premium even though it would have generated strong gains.

Implementation matters, which means that knowing the details will also matter for any risk premia choice. This requirement for understanding the details is no different than knowing the differences in manager strategies. There is value with doing a deep due diligence.

Monday, June 17, 2019

Inflation - It is still about minding the gap


There has been so much discussion about hitting the 2 percent inflation target that it is often good to go back to basics. Investors should keep in mind the simple rule that inflation cannot really rise above expectations unless the output gap is closed, not just for the US, but for the global economy. This goes back to classic macro and an expectations-augmented Phillips curve model. If inflation is below inflation expectations, it suggests that there is still an output gap. (See "Is Inflation Just Around the Corner? The Phillips Curve and Global Inflationary Pressures" by Olivier Coibion, Yuriy Gorodnichenko, and Mauricio Ulate in the 2019 AER Papers and Proceedings)

Close the output gap and there will likely be more inflation upside. If the gap is not closed, upward pressure will be limited. Additionally, the US will be hard pressed to see higher inflation if global inflation and output still languishing. The US is not an inflation island separate from the rest of the world.
If inflation is below the expectations, the output gap has likely not been closed. There is still slack in the economy. While capacity utilization is higher, it has taken a long time to close the employment gap which has dampened any possible surge in inflation.

The inflation gap is closing so there is a smaller difference between actual and expected inflation; however, there is still a problem that inflation expectations are low. Economic agents just do not believe that the combination of growth and monetary policy will lead to inflation strongly consistent with inflation targets.


The decline in the output gap and the closing of the inflation gap all suggests that Fed tightening made sense over the last few years. A close look at inflation expectations and CPI percentage changes tell us that the gap was closed. There may be concern that the gap may again increase, but the data, while switching sign, has does not suggest a change in the economic environment. Inflation is not that has to be addressed.  


Sunday, June 16, 2019

Russell survey on smart beta - A mainstream investment choice


More than 50% of the institutional investors polled in the new 2019 FTSE Russell smart beta global survey now have exposure to smart beta products. Smart beta is now a normal part of the normal investment choice set. The key reason for employing smart beta investment is not to provide another passive asset allocation choice but to serve as an alternative to active management. Smart beta, the investing in long-only risk premia, is serving as rules-based method of gaining specific risk exposures without the use of an active manager. 


Investors are not buying unbundled smart beta strategies, but focusing on portfolios of factors. There is a desire to have an investment product that balances between a few risk factors.  Investors still want help with the asset allocation process.

These smart beta allocations are not viewed as short-run allocation decisions but as part of strategic long-term allocations. This seems consistent with the movement to thinking about risk factors and not asset allocations. 

The overall satisfaction with smart beta is high with over 50% of survey responders saying they are very satisfied or satisfied. While there are still a strong percentage of users who want to see more performance information, the smart beta revolution has done a good job of delivering on their investment promises at a reasonable price. 

As comfort levels further increase, we expect there will be more desire to buy long/short risk premia products to gain the full advantage of risk premia investing and not just tilts to long-only exposures. The desire for long/short exposures will require the use of different investment choices like swaps to gain efficient exposures.  

Saturday, June 15, 2019

Why the trade war will continue - It is a not a trade war, it a battle of economic models


The purpose of war according to Clausewitz is simple, "...compel our opponent to fulfill our will" and "war is the continuation of politics by other means."  It may be a last resort, but it is an extension of diplomacy even financial and trade diplomacy. 

These quotes are very applicable to the current trade war between the US and China and represents a part of the diplomatic strategies of each country. Nevertheless, there needs to be a focus on the deeper strategies being played by each country and the implications for investing. The simple view is that the tariffs were increased to change the balance of trade, but this fight is now being played at a much deeper level and is the reason why this conflict may be more protracted. This has become a contest of competing systems; consequently, it is less likely to be easily resolved.

The simple view is that tariffs are a fundamentally new policy response and that the pre-Trump period was absent of import restricting policies. That view is simply not true. Policies such as anti-dumping and countervailing duties have been on the rise since the entry of China into the WTO. The current policies, albeit ratcheted to a much higher level, are an extension of ongoing trade skirmishes, albeit not in the headlines. The amount of tariffs levied has been small but not absent. (See the PIIE working paper from Chad Brown for a good overview #19-7 "The 2018 US-China Trade Conflict After 40 Years of Special Protection")


This is a battle between western economic liberalism and a corporate state mercantilist system; however, liberalism is in the perverse position of imposing tariffs as sanctions on the anti-competitive behavior of state enterprises and state growth policies. These tariffs are not to gain revenue or just make US businesses seem more competitive and bring manufacturing back to the US. The tariffs are attempting to place a wedge in market structures and change state behavior for doing business in China which includes patent and copyright work as well as the transfer of technology that move beyond sharing between business partners. 

The mechanisms of the WTO may not address or have the enforcement powers to change overall business structure in China. The tariff club is ham-handed, but a choice within the tools of financial diplomacy. It may not be the right choice, but frustration with state behavior has made this a tool. Corporations by themselves do not have the market power to ignore or change China, so the state apparatus is necessary. China's will is to maintain the political status quo and continue to achieve high growth through global trade policy.  

Unfortunately, there is no international organization that has the power to change a large dominant player for the benefit of the global community. The end of economic liberalism is tied to the lose of faith in using international organizations and law to mediate these disputes. Currently, no one trade player or group that can impose their will on another, so there is an escalation of policy and rhetoric that will not go away

There are some key themes that should be applied to any portfolio construction:
  • Global growth was driven by the growth in China and the US. This trade war will continue to weigh on growth. As China diversifies its exports, the rest of the world will face margin pressure.
  • Revenue growth from selling across borders will decrease. The absolute level of trade will decrease even if tariffs are dropped. The threat of future sanction is real. We are see a significant drop in trade that is beyond a growth slowdown and that will not reverse in the short-run.
  • Margins for companies with China supply chains will compress. Even with an agreement, companies will diversify suppliers which will increase costs.
  • Cross-border investments between China and US will decrease. The environment is too uncertain. This will apply to real estate as well as companies.
  • For China, dedollarization will be a long-term policy goal which will only cause further constraints on economic liberalism and cooperation.
The net global loss from trade and finance frictions will be based on each country being driven by their self-interest based on what they believe is good for their citizens. Global liberalism and cooperation is a hard sell when viewed through bilateral policy views in both the US and China. 

Friday, June 14, 2019

Equity hedge funds versus equity risk premia

When you invest with an equity hedge fund, you are actually getting two investments. One, a portfolio of equity risk premia, and two, the skill of the manager to blend these risk premia and find assets better than the returns from the premia. Hedge funds provide risk premia style exposure with their skill with the style. For example, a value manager is providing exposure to the value premium and his ability to find extra return. While we are not conducting a factor analysis of the different hedge funds, placing the returns from bank equity risk premia swap styles next the HFR hedge indices provides some insight on the return generation process. 

The positive returns in risk premia this year are focused on four areas, low volatility and beta strategies, multi-style, size, and volatility. We will note that the volatilities for the HFR bank risk premia are in some cases more than double the volatility of the average hedge fund performance. A good portion of the low volatility risk premia came in May when equity markets declined. Equity hedge funds lost money last month, but generated gains in value and growth strategies for the year from the earlier strong movement in equities. There is a greater focus, as expected, on stock picking with hedge funds and not with strategies like low beta that are defensive in nature.

Equity risk premia can be bundled to provide successful alternatives to equity hedge funds, yet their focus on style exposures means there is still room for holding equity hedge funds with stock picking skills that may create more concentrated portfolios of specific opportunities.

Hedge funds - Mixed performance for month and year

Diversification and return, this is what investors want from their hedge funds, but it is the rare case when you can get both. 2019 is shaping up to be no different than the past for the average fund. 

Most hedge funds will have volatilities between bonds and stock indices. Hence, if you want more return, there has to be an improvement in the return to risk versus traditional assets to gain versus the benchmark alternatives. This improvement in return to risk requires skill. There can be gains from diversification of investing styles and risk premia but finding value and exploiting inefficiencies are the keys to any return gains. Year to date, hedge funds, on average, have not been able to generate strong absolute returns. At best, the average fund is generating just over 2 percent. Equity managers have done slightly better given the market gains earlier in the year. 

Investors expect diversification from their hedge fund investments. Yet, it is exceptional to find managers who have low correlated with traditional assets and still generate strong absolute returns. In most cases, hedge funds will have dampened returns versus traditional assets as the case in May for most strategies.

This does not mean hedge funds have failed investors. Rather, there is a mismatch between expectations and reality. Investors have to taper their expectations and understand what is exceptionalism within the hedge fund space. Diversification benefit with return is exceptional.

Thursday, June 13, 2019

Building liquidity is a safe choice in a flat yield curve environment


The focus on inverted yield curves has been on the signal it provides about future recessions, but it is more important to look at how investors will change their behavior given the inversion. It is the behavior that will impact market prices and capital flows and right now it pays to raise cash levels.

  • Current short rates (3-month Treasury bills) are greater than the dividend yield on S & P 500; (2.24% vs 2%)
  • Current short rates (3-month Treasury bills) are greater than 10-year Treasury bonds; (2.34% vs 2.15%) 
  • Holding cash better than stand alone equity risk assuming zero capital appreciation.
  • Holding cash better than taking on duration risk assuming current yield and no movement in rates. 

If there is an expected slowdown in economy which will led to lower rates, then worth taking duration risk but not equity risk. If there is no slowdown, investors may prefer equity risk over fixed income duration risk. If investors are uncertain and risk averse, then their preferences may be with increasing cash at the current low opportunity cost. At the least, increasing cash levels will lower risk but will actually increase current yield. Simply put, every percent decrease in a risky 60/40 stock/bond (SPY/IEF) portfolio will lower portfolio risk but actually increase stand-alone return. This is not a difficult trade if you don't have a strong positive view on stocks or bonds.

If each investor increases the cash portion of their portfolio, in aggregate, there will be a significant decline in demand for risky assets. Prices will have to fall to clear the market. The earlier asset price fears are realized. Of course, cash rates will also fall or the Fed will engineer a decline that will eventual take us back to an upward sloping curve, but that will occur sometime in the future.  

Wednesday, June 12, 2019

Are momentum models better than moving average models? Some useful tips


There are two major strains of models for generating momentum and trends signals. One, analyze simple past price levels (returns) for some look-back period. This is the classic momentum approach (MOM) extensively analyzed in academic research. For example, if the return for an asset over a nine-month look-back is positive (price today above price nine months ago), buy the asset. Two, use the classic trend approach (MA) and buy an asset if the price is above some moving average, linear average, or exponential weighting. The signal is based on some weighting scheme of past prices. 


Recent research has tried to answer whether one approach is better than the other and it concludes that the classic approach of moving averages is a better approach. (See Trend Following with Momentum Versus Moving Average: A Tale of Differences by Zakamulin and Giner.)


The researchers present details on model comparisons that many trend-followers have intuitively know but may have not formally tested. Their work compares MOM and MA models against different autocorrelation schemes to determine which approach has better forecasting skill as indicated by their ability to properly determine market direction. The authors compare models with different look-back periods and show their predictive skills and correlations. This numerical testing allows the researchers to measure the robustness of different models. Their conclusions make intuitive sense and provide a good guide on where modeling should be focused.

The correlations between MOM and MA models are high and gets higher if there is a strong trend, but the MA approach will have more robust forecast accuracy. It is more forgiving in accuracy for changes in look-back periods. This result suggests that MA models will do better when there is trend uncertainty. In some sense, one moving average is not much different than another. On the other hand, using a simple MOM approach can lead to more error.

Put differently, the correlation between two MA models with different look-back periods will be high and stable. You obtain only limited diversification benefit from using more than one MA sign. You will receive more diversification benefit or differences in correlation between MOM and MA models, but the MOM model will have lower forecast accuracy. There is limited value with choosing a model of MA or MOM models.

The choice of model will also depend on the autoregressive behavior of prices. If there is stable and equal autocorrelation through time, then a MOM model may be better, but if there is declining autocorrelation there will be more value with a MA model like an exponential weighted approach which place more weight on recent data. Researchers need to know the autocorrelation features of price data to pick the right MOM and MA model.

The reasons for the failure of back-tests are because the predicted power of any model will change with change in the autocorrelation of the underlying data. Unstable data structure will mean high variation in what is the best model form. Their numerical tests show that on average, in a changing uncertain world, the MA models will do better than the MOM structure. Still, picking the optimal weights for a MA last period and applying to data next period is a risky business; ask any trend-follower. However, this paper can provide some guide dealing with the problem. 

The practical rules from this paper are simple:

  • Prefer MA to MOM models.
  • If you diversify signals match different look-backs with MA or a MA and MOM combination.
  • Accept that diversification across models may be limited 
  • Accept that autocorrelations in prices are uncertain but MA models are more robust (forgiving). 
  • Optimizing over a back-test period is a fool's game.

Monday, June 10, 2019

What is a risk-free safe asset? Safety ambiguity


What is a risk-free asset? Similarly, what is the risk-free rate? It could be US Treasury bills for US investors or for foreign investors who believe that the dollar is a currency of safety. It could be a local short-term rate foreign rate. However, depending on how you frame the question, there can be many risk-free assets or there can be no risk-asset and this is a problem. This issue is not new, but it should be discussed since we are again seeing lower rates around the world. 

Short-term sovereign rates in many countries are negative and there are over $11 trillion in bonds with negative rates. It is hard to say that these are safe assets. If the defining characteristic is protection of principal over time, the current rate environment in many countries says that you should settle for a loss. 

Real rates also are negative for many assets, so investors should settle for an erosion of purchasing power over time. The only way that investor should be willing to hold these assets if they believe that any risky combinations of assets will produce even lower returns. The oddity of negative rates is that it is not a choice of keeping your money versus a chance of gain or loss, but a certainty of losing money versus a chance of losing or gaining some different pay-off. An investor will lose. It is just a matter of how much.


The investment world is a set of risk choices and not safe choices. If your idea of safety is to ensure a certain cash flow for retirement, create a specific nest egg, or generate returns that will meet specific yields or cash flows needs, risk-free assets could be very risky. If you need to meet specific liabilities the risk-free rate could ensure failure. There may not be any risk-free assets. 

The fact that there are no safe assets does not change the fact that investors still have to make relative choices. Some are risky than others. Each have a different set of risks. Difficult choices will have to be made. 

Sunday, June 9, 2019

The credit story - Not a household or bank problem but a corporate problem

As part of the Financial Crisis recovery program, the Fed wanted corporations to borrow for new investments. Low interest rates would drive a credit expansion. Well, now we know what happened. There were excesses but not everywhere. Households have retrenched except for student loans. Bank leverage has been constrained by macroprudential policies. Corporate growth expanded greatly and firms borrowed even more when they thought rates were headed higher. This corporate lending was not just for long-term investing but leveraged loans for companies that are trading at high debt multiples. 


All firms have increased leverage and have taken the markets to leverage levels not seen before. While some can argue that interest expense ratios are lower, principal will still need to be paid.
All of this leveraging makes the economy more vulnerable to a shock, but the composition of lenders is what is truly different. More bonds are held by mutual funds and ETFs which will create liquidity problems. In the past, corporate bonds were held by longer-term buyers who could wait out a cycle. The current liquidity mismatch between buyer and seller may create feedback effects that will make any credit shock more disruptive.

Friday, June 7, 2019

Stresses in farmland - An example of the problem of leverage


A recent Financial Times article "US farmers' borrowing boom is built n shaky land value" highlights the issue of leverage and the overvalue of assets in the farm industry. Farm prices have been somewhat depressed and only worsened withe the decline in exports from the tariff wars. This issue has only be exacerbated for some farmers with the wet planting season in the Midwest. Prices may have moved higher, but if you don't have a crop there is no income. 


Debt is at the same levels as the peaks in the early 1980's, yet now farmland prices are falling. Leverage is increasing for farmers, so they are vulnerable to any shock in the price system. The result will be a disruption in the farm industry structure. Weak hands will have to pass assets to others which may be institutional. Improvements will be delayed and productivity will be shocked. 

This disruption will not jeopardize the crop food chain, but just like the farm debt crisis of the 1980's there will be a human toll and an impact on industrial organization that will affect margins and future pricing. This can be viewed as a fall-out from cheap money for too long. High debt and leverage, cheap money, and market uncertainty will result in unexpected changes. View this farm industry disruption as a warning.

The development of alternative risk premia - Isolating factors


There has been a natural progression of investment developments associated with risk premia. First, there has been the identification of risk premia. Second, there has been the development of long-only focused funds or smart beta, and finally, the pure isolation of risk premia through long/short hedge funds. These developments have not always been sequential, but they should be thought of as a progression from market beta to focused premia. This progression changes the choice set for investors.


Investors have a widening set of premia choices. They can buy beta in a pure form. They can buy bundled risk premia with funds that have a premia tilt either managed passively or actively. For example, their choice could be a value fund or a small cap fund that is benchmarked against a portfolio with this premia. They can buy specific risk premia in a passive long-only form through smart beta which is a more direct approach to accessing a risk premium. For those who want the "purest" form of risk premia, investing can be done through a long/short portfolio. These premia can be accessed through hedge funds, although hedge funds may be a bundle of a few ARPs, or the investment can be done directly through a total return swap which is has a rules-based index for the risk premia.

One of the largest changes in money management over the last decades is the widening of investor choices with a broad map of methods for accessing risk premia. Identifying and isolating risk premia is a significant advancement. Investors can build and tilt portfolios that express specific factor weights in ways not possible just ten years ago.

Thursday, June 6, 2019

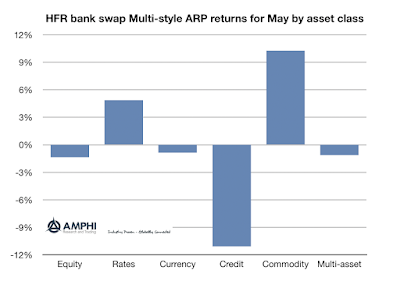
Alternative risk premia performance mixed for May


Returns for alternative risk premia for multi-style swaps which include a bundle of different risk premia categories like carry, momentum, and value have performed well this year, but these swap portfolios showed mixed performance across asset classes in May. Equities styles, as measured by the HFR indices, were down slightly with value and carry declining but low volatility and low beta strategies doing well in the declining market beta environment. Rates did well based on the strong bond rallies around the world. Currencies styles were mixed. Momentum strategies did well, but currency carry was a drag. Currency carry has shown to be correlated with equity market beta. Credit was hurt as spreads moved with the decline in equity beta. There is more dispersion with credit risk premia in these indices because there are less bank swap products. Commodity multi-styles were positive; however, many strategies underperformed based on the wide return variation in different commodity sectors. Overall, the multi-styles strategies were negative for the month.

Alternative risk premia have low correlation with market beta, yet that does not mean that there is no correlation with the market. There is good diversification but when there is a large market decline, ARP returns for a number of strategies will be pulled lower. The composition of the portfolio makes a difference when there is a large market move. As expected, more defensive strategies like momentum/trend and low beta did better in these environments. Our overall impression is that ARP portfolio returns were consistent with expectations.

Monday, June 3, 2019

Strong bond rally but we have seen larger in last decade - Largest since Fed tightening


The current bond rally is strong. Investors are discounting a global slowdown and further trade wars that will trade. There is no question bond investors have turned pessimistic and there is a growing flight to quality, but this move should to be placed in historic perspective. We have seen larger one month and three month moves in terms of basis point declines and we have seen greater percentage declines in yields. Two-year yields changes are less volatile than during the transition between quantitative easings. The 10-year yields have exploded to the downside earlier in this cycle only to reverse direction. This is the largest bond rally since the Fed switched to tightening.

The declines in PMI during 2012-2013 were more dramatic than the current decline, but we do not know whether this economic decline will continue. We could be in the middle of a further PMI fall, so we can easily see further yield falls. 

The market pressure on longer yields places more pressure on the Fed to act given the potential for further inversion. Two cuts are being priced in this year. Whether holding cash in an inversion or playing for a further bond rally, there is a strong case for further switching from risky to safer assets. Even if you are uncertain about economic direction, cash is attractive and safe.