Tuesday, May 31, 2016

And you wonder why companies hold more cash...


When Keynes discussed "animal spirits" and investments, it was not as a complaint about speculative excess but a commentary on the optimism necessary to make investment decisions when the future is unknown and cannot be easily measured. Investment decisions that have to last for five or more years are hard to discount. There is a process for finding the net present value, but determining the cash flows to be discounted is not easy and it will only be harder if there is greater geopolitical instability.

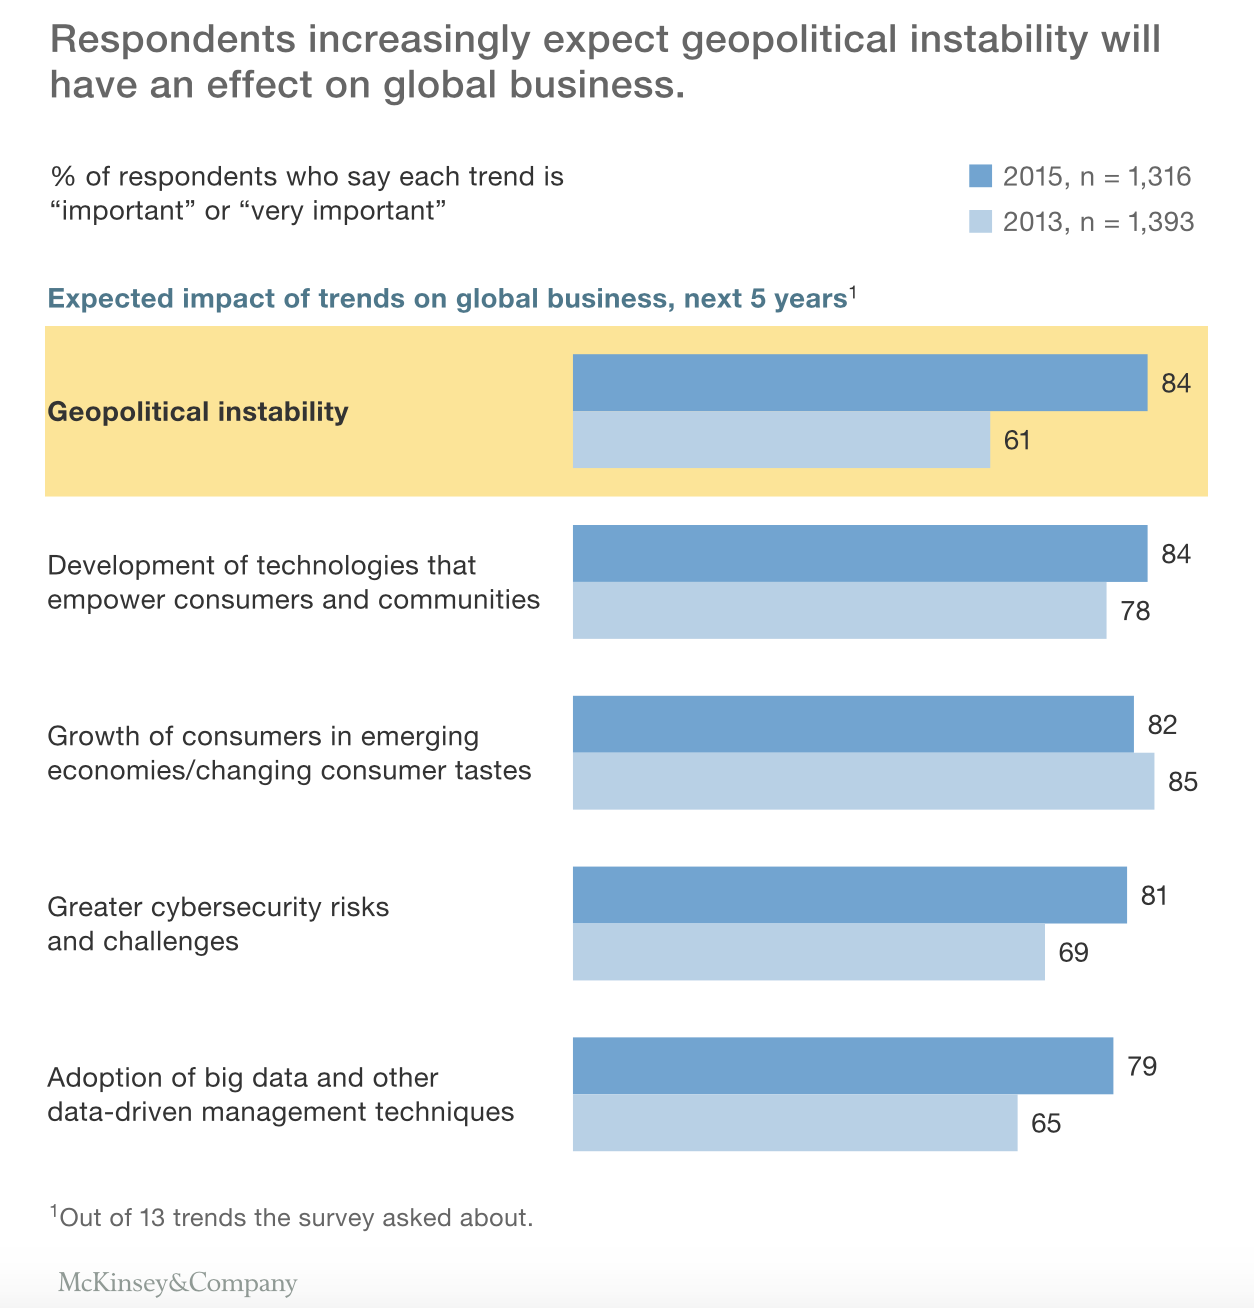
McKinsey's latest survey "Geostrategic Risks on the Rise", shows a significant increase in those who think that geopolitical instability will have a greater impact on their companies over next five years. McKinsey's catch-all for geostrategic risks, (geopolitical, political, and macroeconomic instability), shows this issue to be more important for all executives. 


Executive believe these geopolitical risks will hurt their profitability, yet the same survey shows that less than 15% have taken any steps to address these issues. Additionally, the methods that have been used to address these risk are viewed by these same executives as ineffective. 

I would argue that business executives have addressed these issues. They increased their cash levels and reduced their investment in new projects and people. Cash levels have been tax-driven, but given the low levels of interest rates, there should be more new projects being undertaken. This increase was expected from unconventional monetary policy. In reality, risks trump rates in determining whether there is a company investment. Animal spirits are not positive.

What doe this mean for macro investors? If executives are not prepared for these risks, the impact on companies will be significant and there will be a run to safety when the risks are realized. The demand for safe assets will increase and the managers who switch to bonds and away from risky investments will be rewarded. We have argued that this switch should be rules-based because when the risk events occur there may not be time to wait and see what happens. 

Monday, May 30, 2016

Lack of precision in market views - the need for quant models


It isn't even wrong.
-Wolfgang Pauli referring to a worthless research paper


Most market commentary and opinions are problematic because they just do not say enough with precision. Hence, the Pauli opinion applies. Most commentary isn't wrong but rather the non-opinion opinion.  There is not enough content to be wrong. The commentators often want it that way. They prefer not going on limb with a clear view. The old adage that most forecasters may either get the direction or timing right but not both usually applies.

Most commentary follows a set framework. There is nothing wrong with this framework and it follows a normal story-line. The problem is not with the set-up of the story but with the conclusion. It is the resolution at the end that makes the commentary useful.

A commentary first engages in telling facts; a recap of what is known about the markets, or a selected set of information. There is the view that more facts will add creditability to anything that is being said. The expert provides details. This is useful for providing information to investors but it is not a recommendation. This is a review of the past.

Next comes the analysis of whether new facts or information is good or bad for the markets. This a review of the present and is usually a simple correlation of information and events. The Fed said "x" and the markets moved "y". If "y" moved up, then the information was market positive. This is the approach taken by most reporters. Events are matched with market behavior. Seldom do reporters say that an economic announcement seemed inconsistent with the market behavior.

Finally comes the market view or forecast what will happen next.  This is usually in the form of "I believe", "I think", "It is likely".  There will be some contingent forecasting. If the Fed raises rates, the market will sell-off. There is little precision with this forecast. It is an opinion with little weight or a timeframe for which it will apply. There is often not a clear tie between what has happened in the past, what is occurring in the present, and what will happen in the future.

This is why quant models are so important. The quant model takes data from the past to find relationships. Uses the new data to update the model and the extrapolates the model into the future with some standard error to place bounds on what is possible. This model can be wrong, but it is not worthless. It is not qualitative but allows for some level of precision.

Friday, May 27, 2016

The language of finance: From hypotheses to models and story-telling


The language of science is actively used in finance to describe the activities of academic researchers, but there also is a language of investment management that describes what managers do. This language is often different and at times, at odds with the language of science.

While investment managers engage in financial research, they often do not use words like hypothesizing.  Yet, often what they are actually doing is proposing and testing hypotheses. The investment manager will often use the language of cases and story-telling as opposed to hypotheses and testing. This distinction is important when conducting due diligence. Similarly, investment managers will talk about quantitative models but will often revert to the language of story-telling and descriptions of specific situations as opposed to discussion of levels of significance and probability.

Although it can be viewed as simplistic and stylized, academic financial researchers observe phenomena from data, form models, and test their hypotheses. They often engage in the classic scientific method. Researchers learn from their failure, bring forth new explanation for data, and attempt to advance the science of finance through their ongoing research. Albeit stylized, finance researchers engage in forming conjectures, testing, and learning from failure. There is a focus on inductive logic.

Investment researchers may do the same but may not want to admit it as a process of testing the markets with ideas. Hypothesizing is not usually a word used to describe the research or commentary from investment professionals.They do not like to say that they hypothesize an investment idea and then have it "tested". There is less generalization and a greater focus on specific events and special situations. Nevertheless, there is also a focus on deductive logic whereby there is a theory or story to explain market behavior and then a search for confirmation of the story.

There is switching between inductive and deductive logic by investment managers as well as academic research. It is important for an investor to understand when and how managers move between forms of logic and how they form their theories and test their ideas. 

Wednesday, May 25, 2016

Failure and the need to learn from mistakes


Baseball fans believe a consistent .300 batter is a hall of fame candidate. A basketball player can shoot three-point baskets at less than 50% success and be viewed as special. However, the failure rate for a successful traders is less clear.

Obviously, high returns relative to risk is critical, but returns are generated from the trades undertaken. Often traders do not have a high success rate for trades. In fact, success as measured by a winning percentage is often not a good indicator. The gain relative to loss is critical especially if success rate is lower than 50 percent. The adage is to cut loses quickly and hold on to gainers is implanted in the brain of most traders. Yet, traders with high failure rates need by definition higher win to loss ratios.

The old saying, "It does not matter whether you win or lose, but how you play the game",  is a nice  thought but not accurate. It matters whether you win, but you only get better by understanding how to play the game. Improvement playing the game is based on learning from mistakes. This is why it is so critical to undertake performance attribution analysis. It is also why due diligence is concerning the investment process is so important. If you do not believe me, listen to those who think learning from failure is critical.

Perhaps the history of errors of mankind, all things considered, is more valuable and interesting than that of their discoveries. Truth is uniform and narrow.. but error is endlessly diversified. 
-Ben Franklin 

A real failure does not need an excuse. It is an end in itself.
-Getrude Stein 

Ever tried. Ever failed. No matter. Try again. Fail again. Fail better.
-Samuel Beckett

The purpose of science is not to fool yourself - and you are the easiest person to fool.
-Richard Feynman

The things I remember best from college were the questions I got wrong on the exams.
-Kathryn Yatrakis 

Medicine is a science of uncertainty and an art of probability 
-Sir William Osler founder of Johns Hopkins Medical School 

If a machine is expected to be infallible, it cannot also be intelligent.
-Alan Turing

Tuesday, May 24, 2016

Macro hedge funds - dispersion in asset classes and style


All macro hedge funds are not alike. Macro/CTA's have had modest performance this year, but specialty managers have generated stronger gains.  There are wide differences in performance of managers who specialize by asset class or style of trading. This has led to offsetting performance that has dampened returns for those managers who trade multiple styles, time-frames, and asset classes.  Diversification with mixed performance can force returns close to zero.

To date, macro managers focused on metals have had a very good year. Surprisingly, energy focused managers have not performed as well as might have been expected given the large swings in oil prices. This is a market sector that continues to surprise professional traders. Active trading, discretionary, and systematic managers have all generated good returns in 2016 even with low volatility and unanticipated spikes in equity and bond returns. Global macro managers usually make money in short bursts; consequently,  there will have to be some strong market dislocations to get double digit gains for the year.  


Yield model model for recession - another zombie?


One of the key models used by many investors for business cycle analysis is the change in the shape of the yield curve. An inverted curve sends a strong advanced warning signal of a potential slowdown. This  yield curve model can be translated into a probability measure for a recession, but like the Fed equity valuation model, it may be a zombie model.

It walks around in the modeling environment as if it is a lively useful tool, but in reality, it may be dead as a forecasting signal. It is not a zombie because it has not given a signal since the Financial Crisis. It is a zombie because it does not provide a market-based signal of demand and supply for credit along the term structure.


With unconventional monetary policies keeping rates lows and with a zero bound, it is virtually impossible to get an inverted yield curve. The probability of a recession will never rise above a meaningful threshold without the Fed raising rates further.

We have looked at periods of falling spreads as new indicator, but the evidence is mixed. There can be a consistent decline in spreads without a recession. The inversion has been the key past signal.


Monday, May 23, 2016

Dealing with residuals and working on narratives in finance


The first law of pharmacology - every drug has two effects the one you know and the other one.


The simple phrasing of this "law" show a deep understanding of measurement and uncertainty. The same law could be applied to any finance model. There is the amount explained or known and everything else; the effects we know and have measured from the past and the rest. One of the failures of quant modeling is that the effects you know can only describe a small portion of the variance. The other effects are very big. All of the action and all of the risk is with the other effect, the portion that cannot be explained.

Most investors implicitly know this. This is one of the reason why there is a high degree of skepticism about relying only on models.  This is why telling stories about what is going in the markets at any particular time is so important. The models will get you close to an answer and provide guardrails on what is possible in the market but there still need to be judgement concerning a particular situation.

Now, the type of manager is a function of how they want to deal with these two effects, the explained from a model and the unexplained. The quant will say that even though there is a high degree of unexplained variation, the model is more dependable than any ad hoc decision process. The quant concludes that his ability to provide value on the unexplained is low and may actually take away from the signal generated from the explained.

The discretionary manger will say that the model explains too little of the variation and developing a current narrative is more reliable. Models may provide some guidance but context is most important for making a decision. The discretionary manager will develop a story for "explaining" the current market situation and suggest a reason for opportunity. There is nothing inherently wrong with the approach and it can be based on data and facts.

The key money management question is how to develop effective narratives for the unexplained portions of asset returns. How should these narratives be constructed in a manner that is repeatable? How can decisions be framed through using narratives? If money management decisions are to be consistent, there has to be a process for generating the unexplained narrative.

Friday, May 20, 2016

Fed valuation model is dead and the Fed killed it


A financial model can be dead, but the users may not know it. It can be a zombie model that is out in the environment, was formerly productive, but serves no useful current purpose. This description can apply to the Fed model for equity valuation.

So why did the Fed valuation model become a zombie? - The Fed killed it. 


The model is based on the assumption that there should be a relationship between the earnings yield and interest rates for long-term bonds. Both discount future cash flows. Investors should be indifferent between between these yields. If the earnings yield, (inverse of P/E), is high (low) relative to bonds, investors should buy (sell) stocks and sell (buy) bonds. Of course, this is a relative model which tells use the richness and cheapness of both bonds and stocks. If one is rich, the other is cheap.  It suggests that one may do better or worse than the other and not whether one market will have an absolute gain or loss. Unfortunately the Fed model has failed for some time.

The chart shows the 10-year Treasury yield and the 12-month forward earnings to price. The deviation between Treasury yields and earnings yield diverted years ago and has continued that way without much change. There are strong arguments that the model is poor by construction. A Treasury yield is a nominal rate while earnings will adjust to inflation. Investors should understand this difference; nevertheless, it is still followed by many.

There is no doubt that inflation has been low for most of this period. Additionally, there has been a downward trend in real rates of interest based on a number of solid reasons which can be a cause for the divergence.  Of course, determining the equilibrium rate of interest is even more difficult when rates are close to the zero bound. But, a key reason may be the manipulation of interest rates by the Fed. A manipulated rate should not be used as an anchor for relative value. Following the Fed model would have been financially dangerous.


Nevertheless, the relationship between stock dividends and 10-year yields has persisted up until this year. There is a link with the the actual pay-out of cash to investors and Treasuries but not the earnings yield. This difference between earnings yield and dividend pay-out has not been fully explored.

The Fed model may again be useful, but not until there are Treasury yields that is not manipulated by unconventional policies. 

Thursday, May 19, 2016

A fight against passive investing to protect principal


It is not the strongest of the species that survives, nor the most intelligent that survives. It is the one that is most adaptable to change.  - Charles Darwin 

The strongest current meme in asset management is passivity. It is baked into the index business. It is manifested in the ETF growth. Index growth is based on the passive buying of a basket of assets. The ETF growth is an extension of the index business that delivers asset baskets instead of skill-based fund management. This meme may be changing with smart beta, but there is still is an air passiveness based on the idea that there should be strict rules and structure not a dynamic response to events.

The decision to just hold a diversified portfolio across different asset classes is the strategic choice of many investors. This is the also the foundation of the robo-advisor investment revolution that finds stable diversified portfolios after a review from a set of risk tolerance questions. Investors do not have to make decisions but rather just hold and wait. This passiveness has served many well in the post-crisis period when stocks have moved up in a long-term bull market, but it is unclear what will happen if there is a market downturn.   

A world of passive decision-making is rational when the quality of decision-making is poor. Investors should not take action if the potential action is likely to be wrong.Yet, in a complex unconventional world, being passive may lay the foundation for disaster. 

The factor-based revolution gives investors a better chance to adapt to change. By following trends in factors, there is the opportunity to avoid a major market drawdown. Adaptability to avoid principal loss may be the only choice that investor needs to make and that decision requires vigilance and action. 

Worldly wisdom teaches that it is better for reputation to fail conventionally than to succeed unconventionally.  -John Maynard Keynes

Four factor model and macro bets for managed futures


What are CTA's thinking about the market? This is not an easy question to answer but using a factor model we can find trends in behavior through looking at their sensitivity to asset class exposures. We use a short-term rolling regression to measure the beta exposures to four factors, equities (SPY), bonds (TLT), currencies (DXY), and commodities (DJP). This will only scratch the surface on what managers are doing, but it provides a good first approximation. We have applied this framework to the SocGen managed futures index of large managers which provides general view of the managed futures strategy.

A close look at the most recent readings shows that the negative sensitivity to commodities is almost completely gone. This is a tilt that had existed for close to two years. On the other hand, the positive beta to the dollar has now switched to a strong short position. Equity exposure has moved to positive territory and is increasing while the strong positive exposure to bonds is starting to fall.

It is hard to directly compare these betas since the volatilities of the asset classes are very different, but the direction and magnitude relative to the past are important indicators. This same framework can be used on individual managers to show their sensitivities to asset classes.


Over longer periods, we have found that the four factor model can explain about 20+ percent of the variation in returns. This is reasonable given that over any short horizon the exposure of the managers may be changing. The dynamic behavior of managers will naturally push asset sector betas closer to zero.

We think this four factor model provides good insight on the behavior of macro managers and the managed futures style. The dynamic nature of managers futures makes it hard to build a passive factor-based index from asset factors, but we can gain better knowledge on manager behavior.

Wednesday, May 18, 2016

Simple choices and asset allocation


Simplicity is an important starting point for problem solving.  A simple framework can be applied to asset allocation and the use of alternatives. An increase in alternative is related to the uncertainty of mixing a risky and safe asset. The idea of alternatives as a middle ground between risky and safe assets may shed some light on the reason why some large pension funds have cut their alternative exposure. 

Asset allocation is all about blending risky assets like equity with the safe asset of cash or bonds. If  the investor wants more return, he should allocate more to the risky assets. If the investor wants less volatility, there will be a higher allocation to the safe asset. The safe asset will have a low beta to the market portfolio and may actually have a negative correlation as is the current case with bonds.  

For some, this allocation decision is very strategic. For others, the risk allocation will change tactically. Th core problem is determining what should be the mix between the risky and safe asset, the allocation to assets correlated to "good times" and assets that will do well in "bad times". Unfortunately, this choice is not easy. Allocation to alternatives tries to reduce the problem of uncertainty through finding a "middle" beta with alpha to help with the shortfall of being wrong. 

Alternative beta exposures are somewhere between the risky asset and safe asset. There will be some alternatives that will have a higher beta closer to the risky asset and others may be closer to the safe bond. The expectation is that the alternative investment will have significant alpha to overset the carry from the safe asset.  

So why hold alternatives if can just balance between the risky and safe asset? The reason is simple. The alpha should be enough to offset the drag from the safe asset. The alpha helps offset the risk of getting the choice between risk and safe assets wrong. In the extreme, an investor will want to have all his money in the risky asset when the market is going up and all in the safe assets when the market is falling.  

If a pension fund believes that it can find the right beta through mixing traditional assets, it may not need alternatives. If the alpha from hedge funds falls, then the cushion from holding alternatives is diminished and they are needed less. As pension funds better measure the beta and alpha of hedge funds, they may conclude they can find a better beta mix with traditional assets.

Saturday, May 14, 2016

The best contributors to diversification will surprise you


Investments with hedge fund managers will generate significant diversification benefits. This has been the key selling point for managed futures and other hedge fund styles, yet a closer inspection makes for a more complex and mixed story.

Our simple review over the last three years tells a different diversification story. Buying a portfolio of managed futures managers may not be better than holding more fixed income. You should know what you are getting versus a diversification alternative and any simple blanket view is without merit.

We analyzed the long bond (TLT), the Barclays Aggregate index (AGG), and the SocGen managed futures index (CTA) against the S&P 500 index (SPY). First we compared the correlation of these three diversifiers against SPY. We then look at the risk reduction from adding 10% of each diversifier against holding just equities, SPY. We can then measure the marginal reduction in risk and the marginal return change for the time periods examined. 

This work is not definitive but should cause some careful thinking by investors before they invest in alternatives. Investors should think about the marginal diversification from a hedge fund investment. 

The best diversifier is the long Treasury bond. Call it a safe asset, but it has the greatest negative correlation against stocks. The lower duration AGG index comes in second while managed futures has the least diversification based on correlation. It also has the most volatile correlation. Of course, a longer period analysis will show that the negative correlation between stocks and bonds is variable and there have been periods when the correlation has been positive.
Risk reduction is not based on correlation alone. There is the volatility of the diversifier. A lower correlation asset with low volatility will generate more risk reduction than a higher volatility asset. In this case, the AGG index will show the lowest volatility when looking at a 90/10 combination of SPY and the diversifier. 

Nevertheless, diversification does not come without a price. We can also look at the total return of these 90/10 combinations. You may buy the low volatility asset, but the return drag may be greater than desired. In the three year period, there is more return drag from holding the AGG index, but over the one year period, AGG generates the highest gain. While looking at the return impact is not a core reason to diversifier, it frames the question of cost from hedging.


Diversification can be gained from the right mix of traditional assets, so the question of holding alternatives is more complex and should be based on a complete comparative analysis.

Thursday, May 12, 2016

Drawdown impact and managed futures


A comparison between a simple 60/40 stock bond mix and a managed futures index shows some interesting patterns. Both spend most of their time in drawdowns; however, there are times when there will be diverges in behavior. It is also interesting to note that the stock bond combination max drawdown and the managed futures max drawdown are not that different. A portfolio of managed futures managers does not immediate mean there will be a deeper drawdown versus  simple balanced fund.

The addition of managed futures will cut the size of drawdowns albeit it will be in proportion to the exposure. What may be a surprising development is that the time in drawdowns will be less given the diversification benefit. The comparison with a blended portfolio may be a more realistic way to show the benefits of managed futures.

Simple diversification and changing return to risk


Diversified may be the only free lunch, but that does not mean that there will not be variations in return and changing return to risk trade-offs over different periods. The chart above shows different stock and bond combinations over the last three years against the same combinations over the last year. There has been a marked increase in risk and decline in return. Over the last three years there generally was no dispersion in volatility and just differences in return. For the last year, there has been more variation in volatility and less difference in returns.

There will be different return and risk combinations based on the strategic allocation between stock and bonds. A difference of only 10% in the strategic allocation can have large changes in either return or risk. Making a decision between a 60/40 and 50/50 mix will matter in a low return or higher volatility environment.

Wednesday, May 11, 2016

Active management, fees, and the asset management industry


Do active managers show skill and beat their respective benchmarks? The data one years of study provide a clear answer. For most managers, there is no skill. Managers do not earn their fees, yet you will be hard pressed to find many managers that will argue that they do not have skill. Markets may not always be efficient but they certainly are competitive and the cost of trading is real. Many managers are paid vast sums to believe that they have skill or they at least have the potential to beat the markets. Hence, the great quotes from Saul Bellow and Upton Sinclair both of whom spent time in rough an political city of Chicago.

One of main drivers of the factor and smart beta revolution is how to gain consistent return without having to engage in active management or pay high fees. The Fama-French framework tells us we can use a simple factor framework to better characterize risks relative to a simple benchmark. Smart beta focuses on the fact that rules-based investing can do better than the alternative of discretionary active management.

The advances of finance place an even higher border on active managers to show that they are able to generate value. The value proposition within the asset management industry may just be focused differently than what was expressed years ago. The value of "active management" may be in the structure of risk management and risk factor weighting and not picking stocks. The payment for stock picking may have to switch to payment for risk management and dynamic allocation decisions.

Drawdowns are everywhere - this is a problem of proportionality


"My golly! I can't hold that managed futures fund, it is always in a darn drawdown." I have heard far worse language in reference to a fund in a drawdown.  The logic of the investor is simple. Managed futures funds are bad and risky investments because they are always in drawdowns. I don't like drawdowns. It never fees goods. A drawdown eats into any high water mark and suggests a loss of principal on a mark to market basis.

Interestingly, the focus on drawdowns is a result of the regulatory requirement to report drawdowns. CTA's have to report the largest drawdowns. Mutual funds and normal asset managers do not have to report drawdowns. There is no problem if you don't have to report the problem. 

Look at some simple balanced fund structures that should not be considered risky, the classic 60/40 stock/bond mix and a three asset stock/international stock/bond aggregate combination. Each of these funds spent close to 85% of the days in a three and half year period in a drawdown. The drawdowns have exceeded 7 percent in 2016. Granted the max drawdowns were limited given the diversification with combination. 

I am not arguing not to use drawdowns as a measure of risk. A levered investment can have significantly greater drawdowns than what is reported above. A drawdown is a problem given it shows a loss of principal and requires returns to regain that principal. What is important is having a sense of scale and proportion. Even a low volatility portfolio will spend most of its time in a drawdown and the size of any drawdown will be a function of volatility.

Tuesday, May 10, 2016

Have hedge funds advanced the science of finance?


Has the science of finance advanced because of the the presence of hedge funds? Has our knowledge of finance improved because of hedge funds? These are interesting questions to consider not because it may tell us something about hedge funds, but because it may tell us something about the advancement of science and the development of knowledge in finance. Knowledge improves through its general dissemination. Private knowledge generally does not advance science. So the question is whether hedge funds help with the dissemination of financial knowledge.

Of course, there are hedge fund managers who have engaged and published research, but the broader question is whether they effect the advancement of finance knowledge. This is less clear; however, we think hedge funds do play four different roles to help advance knowledge.

Hedge funds as popularizers
Given the large amount of money managed by hedge funds, they become popularizers to the general investment public of specific strategies. Event driven and merger arbitrage has truly developed through hedge funds. If hedge funds try an idea and it is successful, investors and finance professors will usually hear about it.

Hedge funds as experimenters
Hedge funds can be thought of as experimenters in finance because they take academic ideas and test them in the marketplace to see if they work. Recent research has found that after finance research work is published there is a significant drop-off in returns from the strategy. This suggests that a lot of anomalies found in research will be arbitraged away once hedge funds get at them. They take research and use it.

Hegde funds as patrons
We do not have good numbers, but many hedge funds employ finance professors as research consultants through private contracts. In a sense, the hedge funds are patrons of the finance research conducted. The money is not usually in the form of  a grant to a university, albeit hedge fund managers give to schools, but direct payment for research. A professor could have a patron or benefactor for their work.

Hedge funds as laboratories
Hedge funds also run their own laboratories which is some cases could be as good as many academic finance departments. Ph.D's are hired to do original research for the the advancement of the fund. Some work may get published but most of this work is private and may not advance knowledge in the public domain. Their labs may have the tools and databases to compete with universities.

Given these roles, it might be interesting to ask what research work has been sponsored or done by hedge funds which have truly advanced the science of finance.  I would be interested in what examples readers could give. 


Monday, May 9, 2016

Know your data, the fundamentals of analysis


Thanks to Ben Hunt's latest financial letter, I pulled out my old copies of work by Ed Tufte, the visual data extraordinaire. He may have done more for good visualization and data analysis than anyone over the last 40 years. The Anscombe Quartet says it all if you don't look at the data.

I took the Tufte one day course on the visualization of data over 20 years ago and it has had a profound effect on focusing my powers of observation and my ability to think of clean representations of data. Over the years, I have followed a set of rules when looking at data that has served me well.

My data rule checklist:

1. Graph the data - If you cannot see it, you cannot understand it. Pictures are critical.
2. Cut the data - Look over different time periods to see if there are changes. Data move.
3. Get the stats - Understand the distribution of the data only after seeing it first.
4. Look at the histogram - Find for outliers because this is were money is won or lost.
5. Match data with events - Go both ways  - match outliers with events and big events with data.
6. Generate conditional tables - The power of a 2x2 contingency table is often missed.
7. Check the volatility and correlation  - See whether volatility and correlations change.
8. Compare against good times and bad - Show business cycle and big events on graph.
9. Map theory and prior evidence  - Use priors of other researchers to focus representation of data.
10. Run your regression tests - Be skeptical and focus on residuals.

Good data analysis is a skill that can be learned through following a process.

Inflation pictures all point in same direction


Inflation expectations are higher across a number of measures. The 5yr/5yr forward inflation rates have shown the biggest increases in three years. The break-even inflation rate has increased 50% this year. The University of Michigan inflation expectations are rising and have been consistently above 2.5%, and the change in CPI year over year has been the greatest in years over the last six months. Granted the inflation expectations have been coming off lows, but the upward trend has been clear. Nevertheless, longer-term rates have not fully incorporated these changes.

Investors will face three questions over the next three months. One, how will these changes in expectations be embedded in longer-term rates? Two, how will the data-dependent Fed react to these numbers if they increase further or just stabilize? Three, what is the implicit trade-off between growth and inflation that markets participants are using and that actually exists? Of the three questions, the third may be the most important for investors since we are seeing weaker growth numbers globally.

Friday, May 6, 2016

Global macro themes on one page for May


The month does not really start until the employment numbers are announced. The April job gains were lower than expected and showing a down trend. For a data dependent cautious Fed, there is no evidence to strengthen the case for a rate increase. 

In fact, the numbers for some suggest that unconventional monetary policy is not working. We don't believe in that extreme view; however, at this point in the business cycle, monetary policy may not be enough to sustain growth. Unfortunately, there is no help on the fiscal side, so investors have to balance caution against a world where central banks continue to generate cheap money. We may always keep in the back of our minds the adage, "Don't fight the Fed", but weak growth requires consideration of more conservative portfolio structures.   

Thursday, May 5, 2016

ETF flows and asset class bets


ETF flows provide valuable information on where investors are making their bets. These flow numbers are more important than volume traded because it focuses on the net dollar change into an asset class. This money has to be put to work through buying the underlying investments usually represented by an index. These absolute flows are important, but the percentage change tells us the true net impact of money into these asset classes.

The inflows into investment grade bonds below A, and high yield were very significant after the equity decline earlier in the year. The reach for yield was back in force albeit the last week there has been a net outflow from the high yield sector. As important as the yield search has been the flow into commodities, but this flow has not been focused on oil funds as much as precious metals. The march to lower negative yields has renewed interest in gold. 


Psychometric tests and due diligence


The due diligence of hedge funds is often first rate, but the due diligence on manager skill is still mainly focused on only three factors, past performance, pedigree, and references. Given the tight performance across managers, the wide range of manager experiences, and the limited information from references, investors are still looking for better ways of measuring the skills of portfolio managers. The question is determining how to get inside the head of managers and find out if they have what it takes - skill. 

Skill versus luck is not easy to measure when you have limited data. In sports we can follow a lot of statistics with big samples over years. Even in poker, we can measure skill over a large number of hands with a controlled environment.  Trading in a uncertain environment with highly variable rules makes for more difficult testing.

There has been a growing movement for using different forms of testing or psychometric measures for job interviews. Unfortunately, these methods have been wide-ranging and take many different forms that often seem unrelated to the skills necessary to be successful in a particular job. Can you imagine subjecting a hedge fund manager to job skills test? 

Past research suggests that the quality of undergraduate college and/or SAT scores have an important impact on performance. See the old Journal of Finance (1999) study, "Are some mutual fund managers better than others? Cross-Sectional patterns in behavior and performance". While asking for education makes sense, the relative importance of this education declines as the manager gets older.

What has become very popular has been the quirky math question quiz such as, "How many cigar smokers are there in Denmark?". These are interesting for creative thinking, but it is not clear if they correlate with performance. Unfortunately, these questions have been become so popular that there are actually books that describe these interview questions with "solutions". There are skill tests for programmers, but these do not look at the issue of temperament for risk taking.  There are tests which may show you have an aptitude for risk-taking but that does not mean that you know what are the right risks to take.

Something like a Big Five personality trait tests, which are well-defined, can be used to get some insights on the manager, but again it is not clear how they are related to hedge fund success. A good test should be specific to the skill that is to be measured.

Is there a solution? I will go back to what I think is foundational and information, story-telling. If you can explain what you do, how you do it, and what you learned after the fact, you are more likely to have skill. Hitting a baseball requires muscle memory and reflexes. Finding a good trade and managing risks is a slower process that lends itself to careful considered thought that should be measurable.

April performance demonstrates risk-on behavior

Tracking a range of ETF's provides insight on the market trends for the last month. Just focusing on equity, fixed income, commodity, and real estate gives a good picture of the market landscape. Investors were in risk-on mode for the month even though the market benchmark S&P 500 or Barclays Aggregate indices did not move much. The real action was in the credit and commodity sectors. 

Moving from large cap to smaller cap or value showed significant increase in relative returns. Returns outside the US were also significant gainers albeit a good portion of the excess gain was in the currency move. While the long bond underperformed, there were significant gains in the high yield and corporate bond sectors. These gains from contracting credit spreads occurred even with more downgrades in the energy sector. Sentiment in credits turned brighter with the strong gains in commodities. Real estate did not share the same gains as spread products. Developed international  and emerging market bonds showed strong performance with gains in the currency component of returns.

We will note that this month shows one of the advantages of global macro over managed futures. With a broader focus, global macro can take advantage of credit moves or in factors other than our market exposure. 

Wednesday, May 4, 2016

Hedge fund performance improved in April

Hedge fund performance across all styles generally showed positive performance as measured by the HFR indices. It should be noted that there has been significant divergences between index numbers this month in some styles, but the general story of good performance holds. Nonetheless, the year to date return numbers are still negative even with both stock and bond indices up for the year.

The hedge fund bright spots were the market directional, distressed restructuring, fixed income credit, and convertible arbitrage style indices. Market neutral and systematic CTA's were the biggest losers for the month. It is notable that even with the S&P 500 being positive for the year the equity hedge, equity market neutral, and fundamental growth categories are still showing the worst performance for the year across hedge fund styles. Market neutral has been especially hurt in 2016 as a combination of sharp market moves with changing correlations have left these traders with drawdowns that have been hard to manage.

The overall picture as we move into May is mixed. While hedge funds may have disappointed for the first four months of the year, there is enough time for performance to move into positive territory. Unfortunately, for hedge funds to perform better may require dislocations in equities and a more challenging environment for fixed income. Hedge funds will generally lag in a market directional (beta-driven) environment.

Tuesday, May 3, 2016

April futures returns - Calm mixed with commodity trends


There was a disconnect between the performance in market sectors and the performance of managed futures funds based on our simple review of market sectors. We run each market through a simple trend model each month to determine the direction of the majority of markets in the sector and then make a sector profitability assessment.  April was a strong month for commodities although the increase in volatility made entry into these trends difficult. 

Grain markets saw a significant increase in volatility that made active trading in options very successful. For trend-followers, the environment was challenging but did offer strong opportunities. There were also good trends in cocoa, cotton, and sugar.  The oil complex showed strong gains in spite of fears about the oil rally be overdone. Base metals were also volatile but generally moved higher. Precious metals, especially silver and platinum, generated good trends. 

The currency markets moved in tandem with commodities albeit at lower volatility. Generally, a weaker dollar will see stronger demand for commodities. The Fed being on hold and concerns about the US economy caused more dollar sell-off. The biggest currency risk was the strong yen move on the lack of further action by the BOJ. Rates markets were rangebound given stable central bank expectations.

Equity and bonds markets were much calmer in April relative to the moves seen in the first quarter. The stable Fed behavior and mixed views on the economy kept markets relatively rangebound although there were a number of short-term trend opportunities. 

April managed futures disappoints - could not catch commodity move


The SocGen managed futures index declined by over 2 percent for the month of April. This decline was in the face limited movement in equities and fixed income markets for the month and a strong move for commodities. Currently, the managed futures index, year to date, is higher than equities but has fallen behind bonds and commodities.

The monthly returns for an asset class can miss the gyrations that may occur during the month, but equity as well as fixed income markets were relatively calm for April relative to what was seen earlier  in the year. The mix of continued unconventional monetary policies even with no further action by the Bank of Japan and increased fears of slower global growth were enough to keep stocks and bonds somewhat rangebound. 

What is surprising is the negative performance in the face of strong upward trends in commodities. There are no rules of thumb, but trend-followers generally will do better in up markets than down markets. Up trends are usually smoother. That said, the commodity markets showed wide swings in intraday ranges especially in the grain complex. Along with a renewed trend in oil markets, grains and a number of soft showed up trends, albeit with higher volatility. 

High volatility always causes a longer lead time before entry into trends and usually results in smaller sizing of positions. If the current commodity trends continue, we expect CTA's to show better performance in May.


Long-term secular trend in rates - A big issue


There needs to be a certain fatalism with the current long-term secular trend in real rates. Real rates  are expected to stay low after its continued march down over the last thirty years. This is the reality that has to be grasped by all investors.

An asset allocation decision to hold bonds is not going to provide attractive yields. Alternatively, the big bond bear that has scared investors is unlikely to occur.  Global real rates are expected to stay low, around 1 percent. EM real rates will be higher, albeit lower than in the past. There will be variations based on risk and country specific issues, but the mean levels will stay low by any measure of medium-term horizon.

Long-term real rates have fallen about 450 bps over the last 30 years. Around 400 bps can be explained by the some long-term secular trends. See "Secular Drivers of the Global Real Interest Rate", Bank of England Staff Working Paper No. 571. A long history shows the 1960-1980's were unusually high for real rates. The change in headwinds suggests that we will not go back to those old days.


The decline in real rates have been associated with a slowing of global growth, shifts in savings and a decline in the demand for capital. These factors are not going to change in the short-run. The shifts to increased savings are associated with the demographics of aging, higher income inequality, and an increase in precautionary savings by EM countries. The demand for investment has fallen with the falling relative price of capital, lower public investment, and an increase in spreads versus the risk-free rate of return. The combinations of shifts in both supply and demand have resulted in a lower real rate environment that cannot be changed through unconventional monetary policy.

The 1 percent solution is extremely difficult for pension or savers who are looking to hold long-term passive strategic allocations to bonds and receive anywhere near the historical returns on bonds.

The solution has to be more diversification away from bonds, but this diversification has to be toward different investment styles which likely means more active trading. It could be tactical changes to risk premiums or active trading based on exploitation of skill, but buy and hold bond exposure while not generate high returns. Of course, skill trading cannot be used by all investors. Hence, there is a binding constraint on portfolio returns which needs to be faced sooner rather than later.