Monday, August 28, 2023

Realized versus unrealized losses and the effect on trading behavior


Risk attitudes will change with wins and losses. The general view is that that risk aversion will increase if there is a significant change in wealth, but small changes will not have a large impact. Other work has been mixed on the subject with some studies suggesting that there is greater risk-taking after a loss while other suggest the opposite result. 

An older study, "The Realization Effect: Risk-Taking after Realized versus Paper Losses" provides insight on this topic by showing that changes in risk attitude are related to whether losses are realized or unrealized. The author provides a novel experiment to test this realization effect.

If there is a realized loss, risk aversion will increase while an unrealized loss will have the opposite effect. The study also includes a middle position of telling test-takers about the loss and that it can be realized. This may be related to cumulative prospect theory. The paper losses are bracketed with prospects while realized loss are separated from other activities. Due to loss aversion, traders will take risk avoid a negative outcome.


This has interesting implications for traders who face mark-to-market risk. This research would suggest that the trader will be less risk averse if he has paper losses, but if the loss is realized his view of the world will change. This is another behavior bias that should be deeply discussed with any trading group.

Sunday, August 27, 2023

Cut your losses and let profits run - Not so fast


There is the long-standing adage that a trader should cut his losses and let his profits run, a recent paper generated a different result. See "Cut your losses and let your profits run"

Looking at equal-weighted portfolio, the authors test the idea that cutting losses will add value to a portfolio over a buy and hold. Similarly, the idea of letting your profits run versus taking some profits is tested. In both cases and in combination, the results find that you should not cut your losses based on a threshold nor should you form some threshold for taking profits. There is a upside momentum that may be stronger than downside momentum. Of course, this is a tested against the null that you should buy and hold versus a trading strategy. Nevertheless, this is consistent with the research that suggests that stop-losses do not protect downside risk. There is some value with cutting losses during a crisis, but that assumes an investor knows he is in a crisis. 

The approach taken with this research is simple, but it does provide some interesting food for thought on a view that has dominated much of investing. Do not cut losses. Let your profits run, and beware of the disposition effect. This work supports upside momentum and the fact that you should be aware of the disposition effect. 


Saturday, August 26, 2023

VIX and threshold trading - above a level, avoid stocks


Many have looked at the VIX as risk indicator that can help with determining equity exposure. A recent paper looked at the VIX indicator through a threshold lens. If the VIX exceeds a threshold level, then cut the equity risk and switch to bonds. If the VX stays below the threshold, hold the risky asset. See "Using the volatility index (VIX) as a Trading Indicator"

The question with this type of signal is determining where to set the threshold. One way to solve the problem is to look at a wide set of thresholds and determine the value-added at each level. The authors look at combining a threshold and moving average and find that the 30-59 range will generate positive alpha and the 40-59 range will generate excess Sharpe. 

I am not completely convinced of the methodology, but the intuition is sound. At low levels of volatility trying to trade the VIX as an equity signal is limited but there is a threshold bel over which you want to avoid equity risk.

Risk appetite rising but that does not mean markets will go higher

Risk appetite is a critical driver for markets to move higher or lower. If risk appetite is increasing (falling), there should be a greater (lower)demand for risky assets. State Street does a good job of providing an aggregate risk appetite measure given their knowledge of customer flows. They normalize 22 indicators which include: equities, bonds, currencies, commodities, and asset allocations.

The August report that provides information from July shows that there was a strong directional flow toward risk especially in the second half of the month. The increase in appetite is one of the strongest in years and is near the highest level in a year. Unfortunately, August has become a true problem for those same investors. Appetites change but the food served up for that appetite may not be appealing.

Risk appetite is a good coincident indicator or conforming indicator but may not always be predictive if there is a quick shock to sentiment.


Forecasting the stock-bond correlation


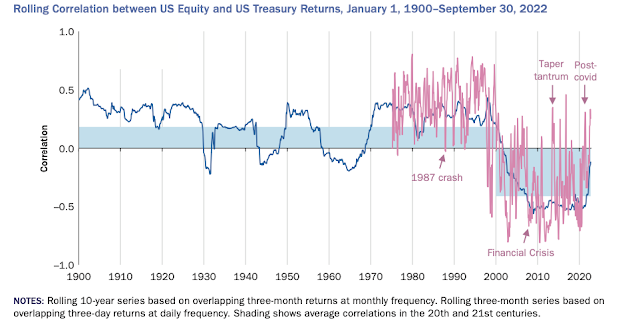
The stock-bond correlation can be measured and predicted using macro variables. This is helpful for any portfolio construction. If we can predict the direction of the stock-bond correlation, we can adjust the overall risk of the portfolio across asset classes. In a more obscure paper, "The Stock-Bond Correlation", the authors compare several approaches for predicting this key correlation and find that a combination of fundamental variables with filtering does an effective job.

The key variables for predicting the stock-bond correlation include: economic growth using industrial production, inflation, relative yield of stocks and bond, and relative volatility of stock and bond yields. The authors use partial sample regression to better support their analysis.

The conclusion is that fundamental data can add to stock-bond predictions and improve forecasts over simple extrapolations. Investor don't have to fly blind on this key correlation.


Looking again at the stock-bond correlation


The one issue that has been vexing portfolio managers for years is the correlation between stocks and bonds. Is it positive or negative? if it is negative, bonds serve as a great diversifier even if rates are low. If it is positive, portfolio risk increases and their case for the 60/40 stock-bond mix is called into question. Investors need to know the drivers of this relationship. A recent AQR paper, "A Changing Stock-Bond Correlation: Drivers and Implications" provides more light on this situation. 


The negative correlation of this century is not the norm, so the key question is whether the last 20+ years will continue. Of course, the relationship. has not always been negative in the short-run. Clearly, this correlation is based on macro drivers like growth and inflation which show the distinction between stock and bonds. 


This macro relationships can be structured as growth and inflation shocks or as the sensitivity of returns to the volatility in these macro variables. If we know the signs of these variables, we can judge what will be the covariance and correlation between stocks and bonds. It then becomes a matter of measuring the relative sensitivity of growth and inflation.


When tested in a model, we can predict the correlation and make judgments on the direction. This can be done both for the US or any country. This framework works around world and with specific industries or risk factors. 


The key drivers for prediction the stock-bond correlation are growth risk, inflation risk, and growth-inflation correlation. There is a negative relationship with growth volatility, a positive relationship with inflation volatility, and a negative relation between with the growth-inflation correlation. While the stock-bond correlation is expected to rise, the overall direction for the next year is not clear given the changing volatility for growth and inflation.


Thursday, August 24, 2023

Yield curve inverted, so where is the recession?


It has been the view that the inversion of the yields curve as good as you get leading indicator of a recession. If the curve inverted, there will be a recession. It is just a matter of time, but timing is one thing that you cannot always control. You can look at the 10-year / 2-year inversion or the 10-year /3-month spread and get the same answer, the recession arrival is not always just around the corner. 

For the 10-year / 2-year spread, the range is between 159 and 705 days with an average of 325. For the 10-year/ 3-month spread the range is between 293 and 684 days with an average of 436 days. Currently the 10-year/2-year, has been inverted for 509 days while the 10-year/3-month has been inverted for 309 days. The tables are from NASDAQ (y-charts) and created on Jun 27, 2023. We calculated the time since inversion as August 23, 2023. 

For both inversions, we are not running too late. We are beyond the average for the 10-2 spread, but have not hit the average for the 10-3-month spread. If you are thinking about the recession trade, you may have to wait until we approach 2024. 


Monday, August 21, 2023

China growth more than a liquidity problem


The forecasts for China growth have fallen significantly in the last three months and are now below the target level set by the government. The PBOC has responded with rate cuts, but there is now the growing view that this is not a liquidity problem but a structural problem. As said by Michael Pettis, "As Keynes explained over 90 years ago, liquidity is a constraint on investment, not a cause." 

You can make funds available at attractive rates but if there are no good projects or no optimism about the future, there will be no new borrowing. The borrowing should not be by the government, but by firms that believe there is a reason to expand. This expansion has to be domestic and not based on more trade. The constraint is not liquidity but animal spirits, the optimism that there is a reason to invest, 

Sunday, August 20, 2023

Random forest support better decision-making


The key problem of any model is overfitting and selecting a set of features that work well with a specific set of data but does not have forecasting power outside the training set. A core advancement of machine learning is solving these problems of overfitting.

Data analysis has improved greatly with the development of decision trees, non-linear analysis that looks at splits in data to determine predictions. Instead of fitting a line through a set of points and minimizing errors, the process focuses on splits across a set of variables to make successful predictions.

For an investment tree, it could be as simple as if earnings move higher by x percent, buy the stock. it is not a linear rule but focuses on action at specific splits or nodes. But how do you know that this is the right split especially if you are looking at a wide set of decisions? 

The answer is to use techniques to simulate more experiments or data to test a model; sampling with replacement. This is called bagging. The random forest algorithm is an extension of bagging because it uses sampling with replacement as well as feature randomness. It is often called feature bagging. The idea is to create an uncorrelated forest of decision trees based on different features. By choosing a random set of features, a set of unique trees will be created which can then be aggregated and averaged.

The decision tree considers all possible splits to find the best splits based on some measure. The random forest looks at all possible splits but for only a limited set of features. The random forest a collection of decision tree drawn from a training set with replacement, the bootstrap or bagging approach. Added random is created through feature bagging which adds more diversity and reduces correlation across trees. The model will have to set the number of trees, the number of features for each tree and the node size.  For a regression task, the set of trees are averaged. For a classification task, a majority vote can be taken. These models can then be tested on the data outside the training set.


The result is a model that has less overfitting, has a high degree of flexibility, and the ability to find the key important features. The problem is that the process is time-consuming, requires a large dataset, and has a greater level of complexity over single decision tree.

In case you forget, real rates matter


For over a decade the real rate of interest has been negative. This was a great period to borrow money and leverage investments. This period was not normal regardless of the length of time. The rate world is normalizing and that means the real rate will be positive and closer to the long-term growth in the economy. 


Nevertheless, there is still room for debate on what is the current real rate of interest. A simple version is the nominal rate minus the inflation rate, but that may not reflect expected inflation over a specific horizon. This simple measure real rates are just turning positive. If we look at nominal rates minus breakeven inflation rates, the real rates have been but getting more positive. The story is still the same; real rates are moving higher and this matters. 

Higher real rates increase the true cost of capital Levered firms will lose. New investment project will be placed on hold. The housing market will further tighten. Economic activity will slow although the extent of this slowing is unclear.  Stock market valuations will decline.

Some are calling for a market crash which is a sudden revaluation based on a significant change in expectations. Whether this is likely is up for debate, but the probability of a large down event will increase with an increase in real rates. The TDEX tail risk index is moving higher but still below the maximum levels set earlier in the year. 

The core message is that real rate normalization will have spillover to the rest of the economy and asset prices. Fixed income repricing cannot be looked at in isolation.

Bond vigilantes - Saddle up boys!


Bond vigilantes is a great term for traders who price bonds with an eye on reality. Of course, who knows what reality will be? It can refer to the difference between the hopes and dreams of policymakers and the real impact of rate changes. 

The hopes and dreams of policymakers are fourfold: 
1. The rise in rates will have limited impact on the overall growth of the economy, there will be a soft landing. 
2. The size of deficits do not matter. The US Treasury can issue a trillion this quarter and over $800 billion next quarter and there will not be a meaningful impact. 
3. There is no need for a term premium in rates, normalization to pre-GFC levels will not happen. 
4. Inflation will return to the 2% target albeit it may take some time and rates will fall accordingly.

The bond vigilantes take a different view: 
1. The return to the inflation target will take longer than expected even with the current successes. 
2. Fixed income is riskier than expected and the term premium will rise 
3. The size of deficits do matter especially when the Fed is still following QT. There will be upward pressure on rates. 
4. The rise in rates will have a stronger impact on economic growth.

The vigilantes may not impose discipline on the market. They represent a different view on reality. 

Friday, August 18, 2023

Change the driver of return - Learn to accept change


Changes aren't permanent, but change is. 

-Neil Peart 

This is a simple view, but simple thinking is often a good starting place for any decision making. Any given change will end. Trends will end. Themes will end. Growth cycles will end. Investment factors, styles, and premiums will end. 

Nothing is permanent. We must accept all changes as being inevitable. The only thing that that is universal is change. 

This does not mean that we always must change to the latest fad or fashion. It does mean that we have to accept it. There will be periods when a style is in and out of favor. Investing is about exploiting those periods when you have an edge and cutting or controlling exposure when your style is out of favor or in transition. The only successful investors are those that accept that change is just a part of a natural order. Nothing will last. 

Tuesday, August 8, 2023

Macroeconomic uncertainty still high post pandemic


Using the latest index of macroeconomic uncertainty that is based on over 132 macro time series, we can see that unlike other post-recession periods, uncertainty has remained elevated. The only comparable period is the early 1980's when there were twin recessions. All other periods show a decline to long-term averages. This elevated uncertainty is applicable for 1-mont, 3-mont, and 12-month horizons although the data end at the end of 2022. 

The high uncertainty has clearly impacted investment allocation decisions; however, it is still surprising that risky asset returns have moved higher. Perhaps an updated series will show a decline consistent with the fall in VIX and MOVE index and thus create normalization and a demand for riskier assets. 

Wednesday, August 2, 2023

The unnatural yield and yield curve environment


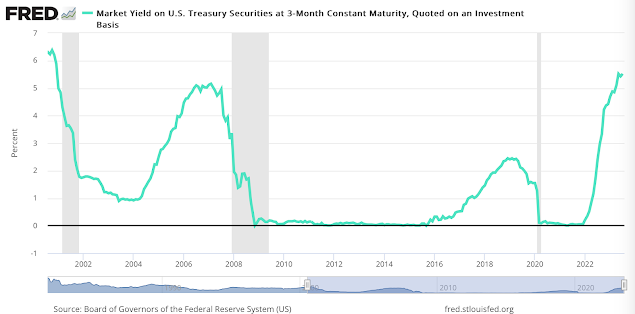
When will we have a normal yield and yield curve environment. First, we lived in a zero interest rate environment that created perverse incentives for investors. There was movement out of cash and bonds - the reach for yield. Now, we have another unnatural yield environment, the strong inverted curve. An inverted curve creates a different set of incentives, the reach for cash. Instead of investing out the yield curve or buying risk assets, there is an incentive to hold cash. 


The natural yield and yield curve environment is a nominal yield that is equal to the long-term growth rate plus the expected inflation. The normal yield curve is upward sloping where longer maturities provide investors with higher yield. If there are large deviations from normal you must ask the central bank; what the heck are you - overreacting with loose and tight policies. 

Fitch rating downgrade of US to AA+; The spotlight is on debt


The Fitch rating service lowered its sovereign rating on US debt from AAA to AA+. S&P lowered its rating on US government debt a decade ago to AA+, so this is not the first rating downgrade. The market reaction was muted on the announcement, but it seems the current market talk is causing some market uncertainty on the future debt picture. 

Hard to say there was any surprise with this change. The report was very clear in its analysis. The argument for the downgrade was based on the likelihood of further deterioration of US finances over the next three years given tax cuts, spending increases, potential economic shocks, and the ongoing gridlock associated with debt ceiling crises. Treasury Secretary Yellen disagreed with the Fitch assessment and said the downgrade was "arbitrary" and "outdated".

 Of courses the Treasury is planning to float over 1 trillion in new debt this quarter and over $850 billion in the fourth quarter.  This is just after the recent debt ceiling deal was closed. I guess a trillion dollar in one quarter is just not a big deal anymore. 

There is the adage that governments cannot go bankrupt. Obviously, the power to tax can solve any problem, but we were just on the brink of a default two month ago and nothing in the financial picture changed.

The market already believes what Fitch has stated in its report. To a degree, the US Treasury is too big to fail. As the most liquid debt market, there are no alternatives, yet it is likely that we could see a default in the next three years. Anyone who does not believe the probability of default is meaningful has just not been following the bond market or followed any of the debt ceiling debacle. 

Tuesday, August 1, 2023

What if you don't want believe? The problem of motivated investment reasoning


It takes more information to make you believe something you don't want to believe than something you do....

Motivated reasoning is a pervasive tendency of human cognition...People are capable of being thoughtful and rational, but our wishes, hopes, fears and motivations often tip the scales to make us more likely to accept something as true if it supports what we want to believe.

-  Peter Ditto

We often have all the information in front of us, but we just don't want to follow it. We don't want to believe. There is a problem with data that contradicts our narrative. We will not believe it. It must be flawed. It must be an outlier. It should be discarded. We are motivated by what we want to believe not what contradicts our current wisdom., 

From a narrative, investors will often search for information that confirms the story. The opposite is a better approach. Start with data and then form the narrative or story. Unfortunately, the process of moving from data to narrative is often messy because the data is messy. Data will often contradict. There is little clarity. On the other hand, a good narrative or story is consistent and makes sense. We develop this story and then look for the evidence that will be supportive. 

The value of quant work is that there is no motivated reasoning. A trend is either up or down. A signal is yes or no. Of course, there is personality with any model, but the focus is on following the count. If the numbers tell you the odds are favorable, you do the trade. There is a belief - a belief in the system.