Monday, July 15, 2019

A Century of Factor Premia and Timing Evidence - What you need to know - Part I


Risk premia across assets have been extensively tested but over different time periods and using different testing methodologies. Risk premia have existed for as long as we have data across a wide set of asset classes and for a number of different styles including value, momentum, carry and defensive. The value of risk premia is well documented by the research folks from AQR Capital in their opus "Factor Premia and Factor Timing: A Century of Evidence" that was updated last month. This research piece provides a wealth of information and thoroughness which should make this paper required reading for those who want to get a full analysis of the historical numbers associated with risk premia.  I will break up a summary of their work into two parts, the performance measurement of risk premia, and the potential timing of the risk premia.

The broad risk premia tested have real economic value that has stretched back for long time periods. This research extends the measure of risk premia to almost a century of data confirming what other researchers have found, but in a number of novel ways. Unfortunately, in our next post we will summarize their work on timing which suggests that after testing a wide battery of alternative models, profits from conditional forecasts is unlikely. 

Foremost with this work, the returns from risk premia are real. They are significant for core styles like value, momentum, carry, and defensive. They are present for equities, rates, commodities, and currencies as well as US and international stocks. The value-added is all the more significant when bundled across asset classes or styles.
However, a careful look at the data suggest that excitement about the value-added for risk premia investing should be tempered through comparing the data before and after the original sample used for finding these premia. Generally, the original data sets show stronger results. Thus, it is fair to conclude that risk premia are meaningful but not as significant as found in initial research. The value of risk premia is sample and test dependent. At a minimum, there is clear time variation with risk premia. At worst, some of the results present are from data-mining.


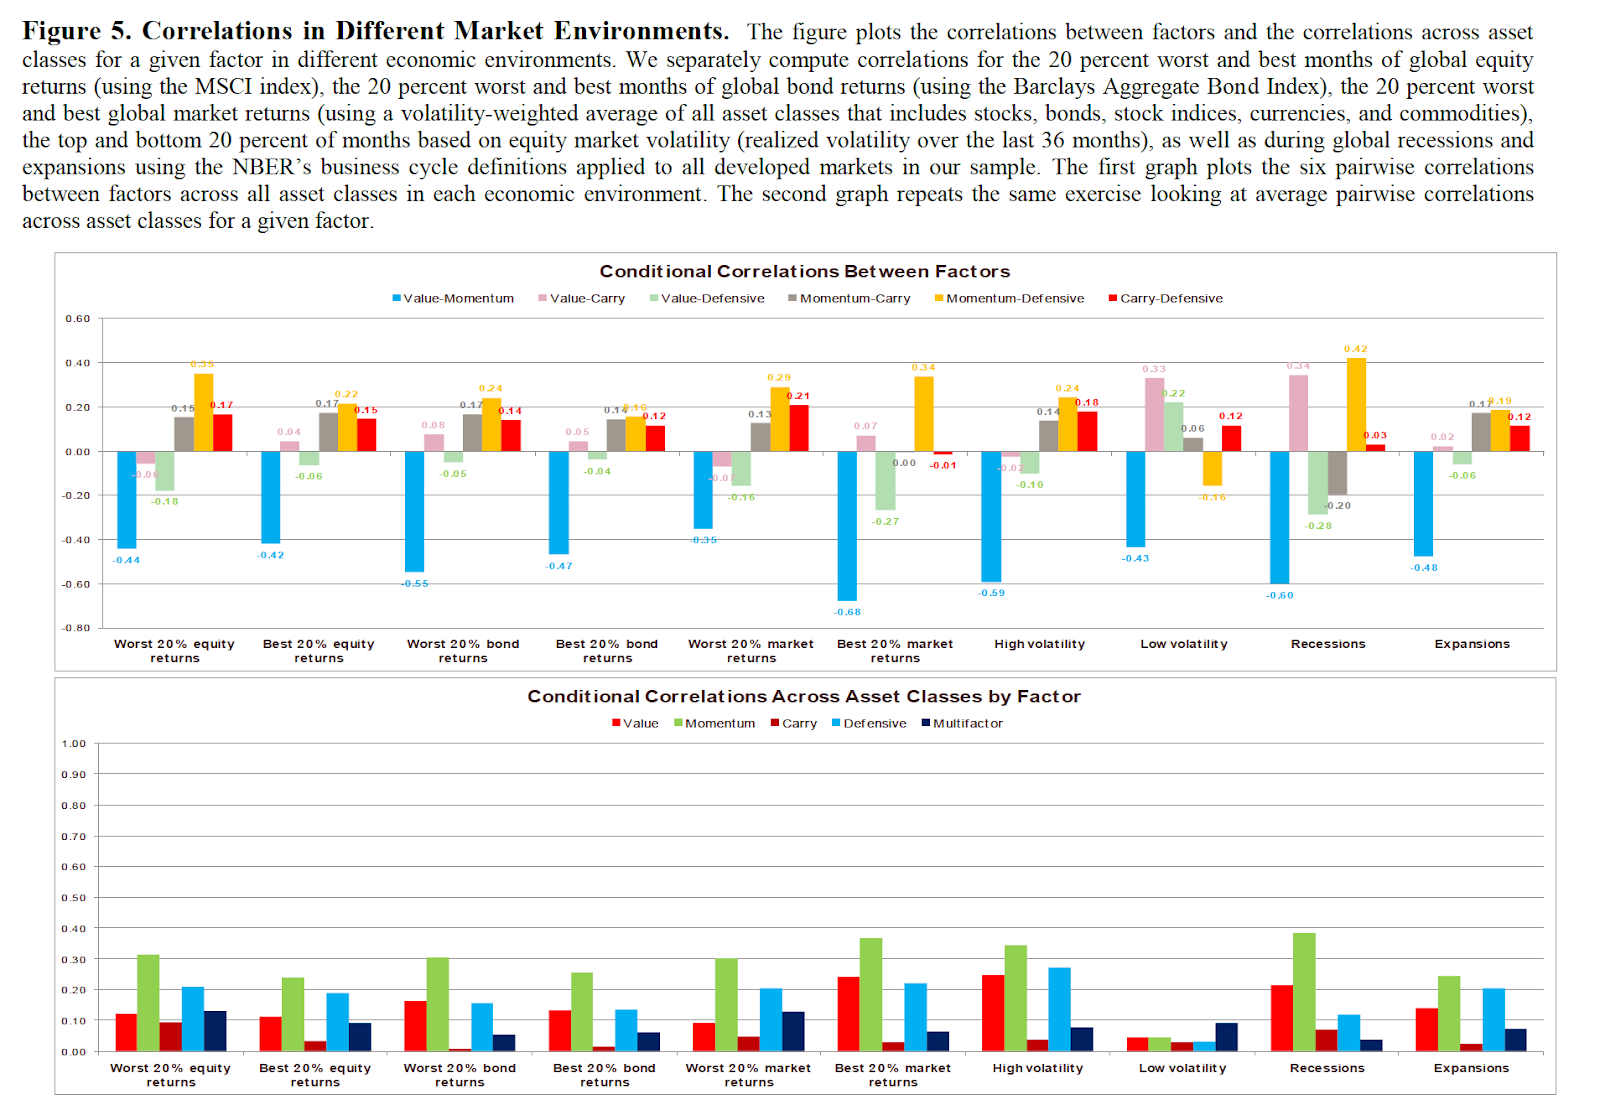
One of the key benefits of these core risk premia is that they have low correlation. They are generally unique, yet the correlations between them are highly variable. The correlation calculated today cannot be expected to remain the same. A portfolio of risk premia will have highly variable performance and risk characteristics. Nevertheless, the data show that some pairing of risk premia like value and momentum will consistently show negative correlation.

The rationale for the time variation of risk premia is not clear. An extensive set of factor for contemporaneous and predictive economic news shows mixed explanatory results. There are only a few macro factors that have meaningful impact on returns. More work on these relationships should be conducted. While this is disappointing, it not overly surprising given the generally poor link between macro variables and market returns. 

It is also found that the correlations between the market portfolio and risk premia are also time varying and fit within a wide range. Still, the data show some relationships, such as the negative correlation between value and momentum are quite strong regardless of the market environment. These relationships help to form the basis for any portfolio construction of risk premia. 

The extensive research on risk premia draws some simple conclusions:

  • Risk premia are significant across a wide set of styles and asset classes.
  • However, identified risk premia are subject data-mining of the original testing period and the long history suggests are more tempered view on return.
  • Correlations across styles, asset class are time varying. The correlations with the market portfolio are also variable.
  • There are some significant economic factors related to risk premia, but there is no strong consistent pattern across style and asset classes. 
  • There are some consistent patterns of correlation among risk premia for different market environments.  

Friday, July 12, 2019

Smart beta portfolio construction - Build a mixed portfolio with some timing


Once there is an understanding of how the risk premia are constructed, investing in (long-only) factors or smart beta portfolios does not have to be difficult. From a core portfolio of different asset class betas, an investor can add further diversification through increasing exposure to other risk premia like momentum, size, value, quality or low volatility. Combination of smart betas can still generate market equity returns but with a different risk profile. 

A simple educational piece "Blending Factors in Your Smart Beta Portfolio" by the researchers at S&P Dow Jones Indices shows that blended portfolios of defensive and pro-cyclical smart beta indices can generate alpha relative to the market index. Centered aat the market beta, it can be seen that different factor portfolios generally have improved return to risk profiles even versus a levered market portfolio. The dispersion of risk and return means there can be further gains from blending factors.


The value of factor blending can be seen through their low correlation across factors. A fair number of factors actually have negative correlation. Note, however, that these correlations are not stable. During times of market stress, there are significant divergences in return relationships especially between factors that are viewed as defensive versus those that are viewed as pro-cyclical. There is room for factor portfolio adjustments especially during periods of stress.


This research piece also address the controversial issue of timing factors in a simple way. Using a trend-following model that adjusts on a quarterly basis, the authors measure the gain from trend timing when you choose the factor with the highest momentum ranking followed by the second highest ranking and so forth. The analysis shows that using even some simple trend management will provide added returns. Interestingly choosing the best trend from a set of factors will not get you the highest cumulative return. However, any combination of factor trends will do better than the market portfolio. 

Factor investing still needs careful attention. There are underperformance periods that can last for years. For example, the core value risk premium, which has a strong economic rationale, has underperformed for an extended period. Nevertheless, combining these smart beta factor indices with some notion of performance timing can generate effective returns versus a market index. 

Wednesday, July 10, 2019

Getting smarter through following trader sentiment (Commitment of Traders)


Everyone wants to obtain a timing advantage with market risk, yet timing is not easy. Timing decisions could be divided into three types, fundamental, price-based, or some measure of investor sentiment information. The problem with fundamental information is that data are often old so there may not be a close link with the information and the models used to find the link are often unstable. Price-based (momentum) systems work in the long-run but can have mixed performance over short-term periods. Sentiment is a diverse area of study but can provide some revealed preference of behavior.

A recent study (see "Want Smart Beta? Follow the Smart Money: Market and Factor Timing Using Relative Sentiment" by Raymond Micaletti) using the commitment of traders information seem to have promise for helping with macro timing decisions. The weekly commitment of traders report from the CFTC report provides data on aggregate position from commercial and non-commercial traders. It also provides details on money manager and dealer positions. 

Commercial trader (hedgers) positions, especially at extremes has been viewed as an important source of information. However, the value of this information for predictions has been mixed. This new research suggests that looking at the commitment of trade information across assets will have value with asset allocation decisions. Simple put, the aggregated information on trader positions in equities, bonds, and the yield curve provides useful market direction information. The combined information may eliminate some of the noise that is associated with information on the futures position in any one asset class.

In the Micaletti study, smart money indicators were developed for stock index futures, bond futures, and yield curve (bond minus note futures). These can be aggregated under the assumption that forecasts for an equity gain will be associated with net long exposure in equities, net short in bonds, and curve flattening. The smart money indicators from the commitment of traders report uses z-scored commercial positions versus the non-reporting positions scaled by open interest versus a median value for different look-back periods. The aggregate smart money indicator tells us where the market should be headed versus some measure of normality. These position indicators are put through a battery of tests to determining forecasting skill. This battery of forecasting tests come sup with the answer that using this information generates forecasting skill.

The indicators also suggest that looking at these smart money indicators add more value than momentum indicators. Additionally, it is found that the smart money indicators can help with timing smart beta risk premia. The smart money indicators can also be used as an effective tactical asset allocation tool.

These sentiment indicators can be updated every week. Looking at a variation of the smart money indicators suggest that a defensive position is more warranted based on negative net positioning in SPX, Treasury bonds, and the difference between (10-year and bond futures).  


Tuesday, July 9, 2019

Follow the relative spread trades from futures traders - They have knowledge


Bond traders may be good macro forecasters, at least if you look at the position-taking of speculative futures traders. The commitment of traders (COT) report (commercial and non-commercial futures positions) from the CFTC for bond and interest rate futures can tell us something about speculative forecasts. Using the net number of speculators in bond futures across the curve, investors can extract forecasts about the change in the slope of the yield curve and thus information on the macro economy. 

The commitment of traders across the yield can be thought of as the revealed preference of speculators about the future shape of the curve. The relative positioning of speculative traders between short and long-term bonds provide a good indicator of the yield curve direction. These curve bets can also tell us something about payroll surprises that are not fully account for professional macro forecasters. These steepening curve forecasts for speculators also provide information on the direction of stock prices. 

This interesting work was conducted by Yang-Ho Park of the Federal Reserve Board staff in his paper "Information in Yield Spread Trades". Park takes the net excess speculators (non-commercial traders) in the 3-month eurodollar futures versus the 30-year (bond) futures to form a steeping indicator if positive and a flattening indicator if negative. This speculative trader indicator is like using the yield curve to forecast future economic activity but with a focus on a group that makes its livelihood trading markets. This research shows is that there is incremental value with using the speculative positioning for recession predictions beyond the term spread. The same result is found for non-farm payroll numbers. The research also finds that spread trading indicators provide added information over an outright trade indicator for a number of futures markets. 

There may be more room for further research in this area since the CTFC also has a long-form report for the commitment of traders which provides more detailed information on dealer, asset manager, and leveraged fund investors. Additionally, the size of the position may provide more information beyond the number of speculative traders. Some may view these as sentiment indicators that add to the arsenal of information beyond price and fundamentals. Certainly the COT data provides details on the behavior of key trading groups in the markets.

What does the data tell us now? The trader numbers from the latest CTFC report are suggesting that the net speculative trader profile is focused on a flattening curve which is slightly perplexing given the active view that the Fed will engage in multiple cuts in rates. It is notable that speculative trader positions are net long the eurodollar futures in the front-end of the curve but the 30-year bond futures speculative positions are almost flat, so the position data is contradictory with the net trader data. The dealer and levered fund communities are net short although the net trader number is almost flat. From the view of traders, perhaps the market has gotten ahead of itself. Trader commitment signals are slightly mixed.