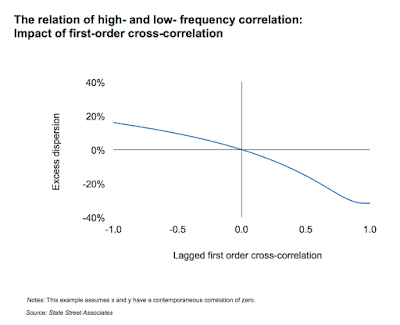
The time frequency for returns will differ if there is any serial correlation or deviation in normality in the return data. Switching between times scales will be a shocker. Calculating the correlation across daily data will not be the same as the correlation across monthly or quarterly data. The correlation in returns between two return series may be high on a daily basis and low on an annual basis. Returns that may have high monthly correlation may have no correlation when looking over 3-year periods. For many investors this may be obvious, but the effects of understanding time scale is important for any financial analysis. It will affect the type of portfolio developed and the weights that will be generated from an optimization.
Similarly, the time frequency for volatility will also be affected by the times series of returns. Daily volatility will not scale easily to monthly or annual volatility. Short-term inferences cannot easily scale to annual inferences. Using the square root rule to scale volatility is a dangerous for any analysis. Divergence across scale is different from sampling error when trying to predict. Positive autocorrelation in returns will add to volatility while negative autocorrelation will dampen volatility for longer time scales.
This is a an important issue given more hedge funds are reporting daily data and not just monthly data. Are you interested in the correlation over a short time span or a long span. The portfolio you will construct will be very different.


No comments:
Post a Comment