Showing posts with label credit issues. Show all posts

Thursday, February 12, 2026

Credit spreads tells about financial risk


The paper, “Credit Spread News and Financial Market Risk,” examines a simple issue. Do the changes in bond spreads tell us something about financial risk that we do not already know? The answer after significant analysis clearly indicates that there is something in credit market pricing that provides insight into the behavior of volatility, as measured by the VIX, realized volatility, and GARCH modeling. If there is a shock to credit spreads, there will be a spillover to higher volatility. Now, this shock effect is centered on recessions, but the evidence is clear. Follow debt markets as another tool to tell you something about financial risk. 


Monday, November 17, 2025

Creditworthy - An interesting history


We take for granted the process of receiving a credit score and the distribution of our credit history across banks and retailers, yet both are recent phenomena. We also assume that retailers' credit extensions are relatively simple. Pre-Civil War, most retail purchases were made in cash or with simple extended terms from a local grocer or retailer. Credit amounts or ratings were held by an single institutions and only extended to those that were know. 

As cities grew and consumers, this was not a workable solution. Even in a city, there began sharing arrangements regarding customers' credit histories. Runners would move from store to store to gain information on a new customer. The transaction costs were high, but not knowing the consumer was costly. 

Suppliers placed pressure on retailers to pay their bills so retailers had to better know who they were extrending credit to. Lists were made, and the process started to be centralized through local credit bureaus. As more credit was extended, there was a need for more credit professionals and further automation to track and rate consumers. This was furthered through the use of comutuers and the ascent of credit cards.

There is not much to apply to trading with this history of credit information. Still, Creditworthy: A History of Consumer Surveillance and Financial Identity in America by Josh Lauer is a fascinating history that makes you think about the fundamentals of credit information and ratings. 

Monday, March 24, 2025

Corporate spreads and signaling - good time for credit restructuring


We are in an equity market correction with a decline of 10% from the high. There has been a widening of spreads in credit markets, yet the overall signaling in credit still suggests a stable market. One, credit spreads are off their lows but still below the disruptive period of September 2024 when the Fed believed there was a need to cut rates 50 bps. Two, credit spreads are much lower than the bank crisis period of February 2023 and the period of equity market correction in 2022. Three, spreads are lower than the period of higher inflation post-pandemic. 

This may be the beginning of a larger correction which means that investor still have the opportunity to reduce their credit risk. Credit adjustments, short of a crisis, are slow-moving, so there is the threat of being early with portfolio rebalancing, yet given the low level of spreads, pulling duration is an easy way of offering portfolio protection.


Wednesday, November 13, 2024

VIX and corporate bonds


There is risk in corporate bonds and this risk can be measured through the VIX market. Equity and bond markets are linked. This should not be surprising since the corporate structure can be divided in equity - the residual value of the firm which is call option and bonds which are a short put option on the firm value. A change in volatility will lead to a change in the value of these options. If the VIX serves as a proxy for equity volatility, then there should be a link with bond spreads which are the added risk above Treasuries for holding corporate bonds.


The authors of an early draft paper, "The VIX as Stochastic Volatility for Corporate Bonds" show that adding the VIX to a time series model of corporate spreads will improve the time series model. First, the residuals of corporate bonds spreads are not Gaussian white noise; however, if you scale the residuals by the VIX to standardize, you will get an improved model. The spikes in spread are dampened when they are scaled by equity market volatility. This is a simple model and test, but it serves as an important improvement over looking at just the simple time series of spreads.

Wednesday, February 28, 2024

Is there a consumer credit problem?


 So let's look at the rational consumer. Consumers should be cutting back on credit usage. Consumers should also be facing greater risks because the cost of holding balances is higher today than three years ago. Every income group is showing higher delinquencies. This is not a low income group problem. This is also an issue across generations. Younger generations have higher delinquencies than older generations. This generational difference has always been the case, but we are seeing every group having growing credit problems. There is no recession and growth is good, but it is not clear household finances are feeling it.   

Sunday, February 25, 2024

High yield spreads and equity volatility


The focus for most investors has been on equity markets. Equities have had a nice run especially with the decline in recession expectations. Rates have been confusing for investors. The expectations were for a strong decline as the Fed changed gears towards a looser policy. The market is adjusting to a more cautious Fed. The critical issue is with credit given the strong demand for credit funds especially in the alternative investment space. 

There are clear indicators that can be used to help with assessing the credit arena. Economic growth is one for the macro environment. Earnings is a key indicator for micro credit investing. However, a clean simple indicator is the VIX index. If equity volatility, a proxy for uncertainty, is on the rise, there will be an increase in credit risk. In general, if the VIX is below 20, they're low likelihood of a spread increase. If the VIX index is above 20 and rising, there is greater credit risk regardless of what rates may be doing. Of course, facing rates make it easier to refinance, but the compensation for holding corporate risk can still higher. There is little current credit spread risk.

Monday, October 9, 2023

The credit and asset price cycle - The potential for bubbles


From Between Debt and the Devil: Money, Credit and Fixing Global Finance by Adrian Turner 

This credit and asset price cycle map provides an effective description of the feedback loop which creates a cycle. Start at any point in the cycle and you can walk through how credit gets extended and leads to higher prices. you will get the opposite if there is a fall in prices. Of course, one of the key components of the credit cycle is the link between rising prices and higher expectations for future asset prices. Once you have momentum as a driver of expectations you are ready to have a positive feedback loop and potential for a bubble. You need a negative catalyst to shock asset prices and force expectations lower.

Momentum, which leads to higher prices, allows for more lending against the higher collateral values. The lending will lead to more borrowing which of course forces prices even higher. This is why change point detection is so critical. An investor needs to develop tools to measure or assess when the reversal will begin. The reversal of the credit cycle is not likely to be immediate once there is a fall in prices, but investors need to realize that once credit is pulled from asset markets the price declines will increase.

Trends in all assets can be closely aligned with the credit cycle. Unfortunately, it is often hard to match credit extension with specific markets, so it is hard to see the flow-through in the cycle.

Wednesday, August 2, 2023

Fitch rating downgrade of US to AA+; The spotlight is on debt


The Fitch rating service lowered its sovereign rating on US debt from AAA to AA+. S&P lowered its rating on US government debt a decade ago to AA+, so this is not the first rating downgrade. The market reaction was muted on the announcement, but it seems the current market talk is causing some market uncertainty on the future debt picture. 

Hard to say there was any surprise with this change. The report was very clear in its analysis. The argument for the downgrade was based on the likelihood of further deterioration of US finances over the next three years given tax cuts, spending increases, potential economic shocks, and the ongoing gridlock associated with debt ceiling crises. Treasury Secretary Yellen disagreed with the Fitch assessment and said the downgrade was "arbitrary" and "outdated".

 Of courses the Treasury is planning to float over 1 trillion in new debt this quarter and over $850 billion in the fourth quarter.  This is just after the recent debt ceiling deal was closed. I guess a trillion dollar in one quarter is just not a big deal anymore. 

There is the adage that governments cannot go bankrupt. Obviously, the power to tax can solve any problem, but we were just on the brink of a default two month ago and nothing in the financial picture changed.

The market already believes what Fitch has stated in its report. To a degree, the US Treasury is too big to fail. As the most liquid debt market, there are no alternatives, yet it is likely that we could see a default in the next three years. Anyone who does not believe the probability of default is meaningful has just not been following the bond market or followed any of the debt ceiling debacle. 

Sunday, March 19, 2023

Credit tightening is already here, but will get worse


Bank failures and crises leads to a tightening of credit. This is the secondary effect that is often overlooked. The focus is on the immediate failure and the depositors, yet the economy will be driven by the credit channel as well. The credit situation was difficult before the bank closures. 

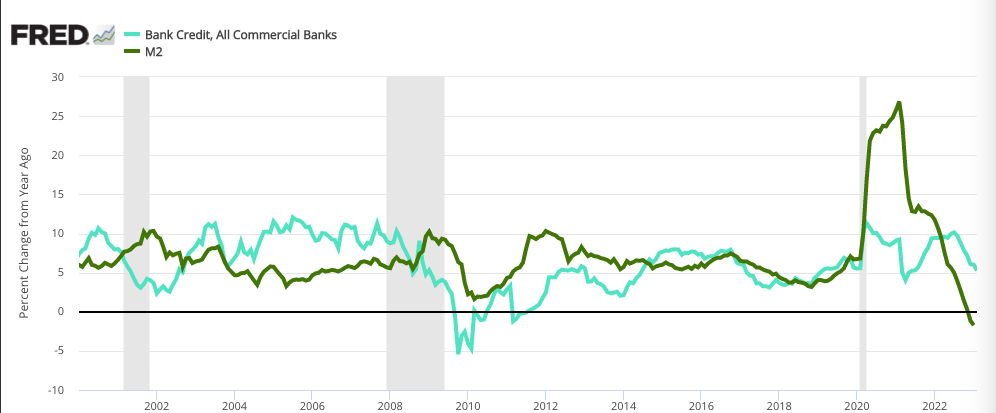
The bank credit standards are tightening across the board and closing in on the highs from the pandemic. There is little to suggest that this trend will change. 

Bank credit growth is slowing. Less loans are being made although a 5% growth is respectable. The trend is falling. M2 money supply growth is now negative. Of course, the supply is still high given past growth, and we will see an increase with the Fed injection of money, but the trend is lower.

The short-term credit has improved with the bank bail-out, but the combination of higher rates, tightening standards, and slowing loan growth does not paint a pretty picture. 


Sunday, February 26, 2023

Disruption drives credit risk - focus on abnormal financings and innovation


Disruption has a large impact on the risk for credit defaults.  Of course, the balance sheet and leverage matter but a new study shows that disruption as measured by abnormally high venture capital and IPO activity sees higher default rate. Innovation and strategy meet the credit markets. New entrants and innovations impact the likelihood that firms will be able to pay their debts.  See "Disruption and Credit Markets" by Bo Becker and Victoria Ivashina. 

Disruption increases default risk regardless of age, valuation, or leverage. Very large firms which may be diversified, or low-levered firms that have an added cash cushion may avoid these higher risks, but if you are in an industry that is going through change, risks of default will be higher.


This work makes intuitive sense and is completely consistent with structural models of credit risk. If there is greater firm volatility from industry disruptions and uncertainty,  default risk will go up and the price of debt will increase. This may not be tradable in the short run, but it provides a framework for accounting for added uncertainty independent of the balance.


Tuesday, December 13, 2022

EU bonds are being repriced at higher spreads based on higher risks


The EU bond market has exploded with well over 200 billion euros in just two years. However, there is a problem measuring how they should be priced. These bonds have a triple-A rating but they do not trade like other triple-A issuers. They used to trade with a premium, but not anymore. The markets perceive these bonds as riskier. See "Do financial markets consider European common debt a safe asset?"

These euro bonds have different issuances and guarantees so they are not alike. For example, the European Investment Fund (EIB), the European Stability Mechanism (ESM), and the European Financial Stability Facility (EFSF) have all issued bonds. The last two entities were started to help vulnerable countries during the euro debt crisis. There are also the Support to Mitigate Unemployment Risks in an Emergency (SURE), NextGenerationEU (NGEU), and the Macro Financial Assistance (MFA) bond programs. The market has treated this as close substitutes, but they have now moved to levels higher than even single-A corporates.
Without the ECB buying the bonds, private investors must the funds to buy this debt and they don't seem to like the terms. It could be a liquidity issue. It could be associated with the newness of the issuer, but the supposed safe asset in Europe may not be that safe, and the Euro bond market may be more segmented than believed earlier. Without the ECB being the buyer of first and last resort, the market is radically different and not as well-structured as the US bond markets.

Wednesday, October 26, 2022

Credit markets - If the funding is tough, the spreads are wider


Credit markets are all at elevated spread levels versus the pre-pandemic period; nevertheless, the spreads are still less than the March liquidity shock. We are not at pandemic levels but certainly higher than the lows when rates were near the bottom of the cycle and liquidity was flowing. What is important is the relative spreads across ratings. Investment grade spreads have moved higher, well over a 50% increase from the lows last year, but the absolute change is spreads have been modest, so the price impact has also been constrained as measured by the spread times duration. For CCC-rated bonds, the spread increase has been substantial with a strong price impact. 

Equity prices have fallen which indicates firm values have declined, but the real problem is higher rates from the Fed and any constraints on credit. The cost of refinancing has surged, so highly levered firms will see more cash flow go to paying bondholders when debt is rolled forward. A problem also exists if fixed rate debt was swapped to floating. Financing costs are going up which means there is less cash to invest in the business. Default risks are rising, and spreads are doing the same. It is not a good time to be an existing high yield holder until rates start to stabilize.

Monday, August 8, 2022

Credit cycle similar to the equity cycle - Declining fundamentals, valuations, and technicals


The credit cycle will often follow the equity cycle. Both are in bear markets. There can be a classic analysis of determining the positioning within the cycle. Robeco, in its credit outlook shows the current credit path with a weighting on fundamentals, valuation, and technicals. They argue that bear markets and market bottoms are dominated by factors other than fundamentals and valuation. We do not agree. 

The widening of spreads is driven by forward-looking fundamentals and valuation not current numbers. Fundamentals are declining based on the expected slowdown of cash flows associated with a growth slowdown and inflation. Valuations are deteriorating based on rising rates and the potential impact of QT which will create a crowding-out effects. Inflation is pushing core fixed income investors to sell duration. 

Sentiment and technicals reinforce the core problems with fundamentals and valuation. Liquidity is a growing problem because there are fewer buyers for corporate paper and dealers do not want to hold these risks.


Wednesday, July 13, 2022

Financial stress - Different Fed measures provide warnings for investors


There are several financial stress indices provided by the Federal Reserve Banks which will often be correlated at the extreme but may provide useful unique information on financial markets. We look at three major indices: the St Louis Fed financial stress index, the Chicago Fed financial conditions index and adjusted financial conditions index, and the new NY Fed corporate stress index.

The St Louis Fed financial stress index - The index consists of 18 weekly data series; seven interest rates, six yield spreads, and five other indicators. There is also a Kansas City stress index, but it only comes out monthly. 

The Chicago Fed financial conditions index (NFCI) - A comprehensive weekly update of financial conditions in money markets, debt and equity markets, as well as the shadow banking system. The Chicago Fed also produces an adjusted financial conditions index uncorrelated to economic conditions. This index is broader than the St Louis Fed index.

The NY Fed corporate bond market distressed index (CBMDI) - The distressed index focuses on seven corporate bond indicators to measure liquidity and stress in a corporate debt market. It is not a stress index across asset classes rather it is focused on liquidity and stress in corporate credit. The NY Fed has a general index as well as investment grade and high yield indices.

The NY Fed distressed index shows the most variation and has the slowest speed of adjustment after a stress shock. Market liquidity comes back slowly after a market shock. The correlations between these indices are high. The high correlation between stress indices (St Louis and Chicago Fed) and corporate bond spreads is related to the fact that these indices include short-term spreads while the distressed indices have exogenous factors from spreads. 


These indices can provide a simple way of efficiently looking at stress from a set of indicators. If these are stress indicators are moving higher, market risks will have to be repriced. 


Saturday, June 25, 2022

Credit spreads and equity levels


Credit investing and equity investing are closely aligned. A bond is a put on the firm. There is only a coupon return and the return of capital. If the firm value declines, there is a decline in the value of the bond. Equity is a call option in the residual value of the firm. Both are associated with the underlying value of the company. Hence, if overall equity values increase, the risk and spread for investment and high yield should decrease. If equity markets decrease, the residual value of the firm declines and the risk to bonds will be displayed in increasing bond spreads. 

We have taken a different look at this relationship through a scatterplot with a line tracking the relationship through time. It provides a different story for how this relationship moves through time and with the level of equities.

Using data from 2012 to June 24,2022, the pandemic dominates the relationship between equites and bonds. There was a credit crisis that far exceeded the equity downturn as measured by spreads. The current equity sell-off creates a similar credit spread pattern, but it seems muted relative to the past at least for investment grade bonds. 

The more interesting relationship is the shift of the trade-off as equity levels increase. Equity markets move and then credit risk adjusts to a new level. There is not just one equity-credit spread relationship.


Credit spreads and mean reversion - works well with trends


Credit spreads for both investment grade and high yield have been increasing with the decline in equity markets. These moves have been especially strong for junk bonds with low ratings. Investment grade have seen muted performance. High yield spreads are at the highest levels in five years if we extract the pandemic liquidity crisis of March 2020. The same can be said for investment grade. Trend-trading in credit is effective especially if it is conditional on the business cycle, equity prices, and financial stability. 

Within these long-term trends, there is also opportunities for mean-reversion strategies using a z-score methodology. If spreads widen by three standard deviations, there will be a spread tightening as new money tries to take advantage of higher spreads. The same can be said for the alternative of strong negative z-scores, however, this effect is weaker since it requires as selling of gains without a natural buyer. 

Investor who are buyers of extremes and hold for even a set time will be able to capture spread mean reversion. This mean reversion can be done in conjunction with trend trading to take advantage of macro and cross-asset changes as well as market extremes. 


Wednesday, May 18, 2022

Credit spreads and the equity decline - corporate risk abounds


Equity is the residual value of the firm and will be sensitive to changes in cash flow. As equities go, so should corporate spreads especially for highly levered (high yield) firms. The sell-off in equities this year is closely correlated with the increases in high yield spreads. The same concerns about margin, leverage, and earnings hit both equity and corporate bondholders.

Looking backwards at default rates will not help investors. It looks like defaults were all put on hold as the economy improved, low rates still dominated, and equities remained strong, but the world has now changed. Defaults during the mini-recession are likely under a stagflation environment, so spread repricing should be expected.


Wednesday, May 11, 2022

Corporate bond issuance and trading impacted by Fed policy and inflation


The market focus has been on credit and fixed income (Treasuries), but credit should not be forgotten. The Fed rate increases will impact issuance, spreads, and trading is this large market sector. 

Corporate bond issuance has slowed especially for high yield. The market is less friendly on an absolute and spread basis.

Investors are rebalancing their corporate bond exposures as measured by trading volume. Large increases in trading occurred around the March pandemic surge and during the first quarter of 2021 when expectations for improved growth hit the market.

Spreads are widening and cost of capital is increasing with more rate increases coming. Corporate treasurers are cautious about raising new funds until the inflation and rate environment stabilizes. Higher bond volatility as proxy for uncertainty leads to financing delays.  


Tuesday, April 19, 2022

Increased corporate credit risk - A fall-out from QE


A provocative paper from the NY Fed "Exorbitant Privilege? Quantitative Easing and the Bond Market Subsidy of Prospective Fallen Angels" tells the tale of unintended consequences from the Fed's extended QE programs. Keeping rates low created the search and reach for yield in the corporate bond market. Borrowers were able to obtain cheap financing and lenders took greater risks than normal. Normal returns and risk measures were discarded. 

We have corporate zombies among us, and this was caused by the Fed's QE policy that forced fixed income investors to buy marginal corporates to meet their liability needs. Now that we are seeing a change in Fed policy, the cost of subsidies to risky corporates will be felt by the same investors who reached for these yields. The impact will be felt especially by bonds on the cusp between investment grade and high yield. 

This cusp risk is made possible by the ratings inflation from ratings agencies who kept ratings stable even as credit quality has deteriorated. 

Could this exorbitant privilege of lower borrowing costs to cusp investment grade firms have been anticipated? It should not have been surprising. In extreme environments, firms engage in extreme behavior. Risks are taken and exploited because consequences are pushed into the future. The negative consequences will now be felt as rates are normalized. 


Tuesday, March 1, 2022

Bond dealers reduce exposure of corporate debt


What are bond dealers doing with their inventory? Tracking inventory is a helpful tool for getting flow sentiment on markets. If there is an increase in dealer inventories, it is a sign that the dealer community may believe that prices are going higher; otherwise, the dealers will not hold the bonds in their portfolio. If hedged with Treasuries, there is the expectation that spreads will tighten. Dealers may be stuck with inventory they cannot get rid of which will lead to excesses in their inventory levels but since bond dealers, especially for corporates, are not required to make markets, we generally find that bond inventories tell us something about the direction in prices.  

The chart above is from weekly inventory information collected by the NY Fed from primary dealers. Like the futures commitment of traders, it may not provide useful information every week, but it does confirm and provide insight at extremes.  The chart shows a combination of both investment grade and high yield bonds held in inventory. All bond exposures have fallen from January highs. Long exposures have especially fallen while shorter maturities have increased slightly. 

The inventory changes are consistent with the spread widening we have seen in both investment and high yield bonds. Given the current market uncertainty, we expect that the current inventory trends to continue.