Monday, July 29, 2024

To and From tables of connectedness are useful


A very useful way to think about connected has been developed by Diebold and Yilmaz in a set of papers that are connected through their book, Financial and Macroeconomic Connectedness: A Network Approach to Measurement and Monitoring. The connectedness table is related to the variance decomposition that is often used with VAR models. The H-step forecast error d(i,j) is just the fraction of i's H-step forecast error due to shocks in variable j. The full set of these pairwise forecasts error relationships for the system can be seen in a connectedness table.

If you have a 4x4 connectedness table, we can look at the pairwise directional connectedness through the off-diagonal elements, d(i,j). If we look at element in the matrix (1,2), we will say that the pairwise directional connectedness is C( of j to i, or 2 to 1). There will be N-squared - N pairwise directional connectedness measures. The net pairwise directional connectedness will be C(1,2) = C(2,1) - C(1,2) which leads to (N-squared - N)/2 net pairwise direction connectedness measures.  

There will be 8 off-diagonal row and columns sums labeled "from" and "to" which are the total directional connectedness measures.  So, the column at the right will be the sum all of the off-diagonals and will say that x% of the variation comes from other markets. The sum of the columns for a give row i tells us the total variation from others to i. If we look at the column sums, this will tell us the total directional connectedness from j to others. We can look at the net total direction effects, through say the C(2) which is the "to" or column impact minus the "from" or row impact which provides the combination effect. The total combination is the sum of the "from" column and "to" row is the total system-wide connectedness. 

We can look at the net connectedness through time for the whole system or we can look at the to or from connection for each element in our matrix. This will tell us the amount of forecast error variance that is due to shocks from other markets. A generalized variance decomposition will be used to create the matrix. 

The "to" and "from tables can be converted into pairwise network graphs to show how market re connected visually.


Two types of forecasters - both are not very good


“There are two kinds of forecasters: those who don’t know, and those who don’t know they don’t know.”

― John Kenneth Galbraith

Accept that forecasting is hard, and most will get it wrong. We can explain only a small portion of the change in returns.  We get the large macro forecasts wrong.We often miss the big picture, yet our livelihood is based on our ability to have some view of the future. It can be simple as saying the returns and the economy will trend, or that using past information can help us say something about future. The question is whether we can form some likelihood about what will happen in the future. The is no certainty and we often cannot even get probability right, yet it is critical that we form some analysis about the future. Just don't put a lot of stock in the forecasts of the professionals. 

Money and intelligence - there may not be a connection


Galbraith says “the specious association of money and intelligence.” When people get rich, others take that to mean they’re smart. And when investors succeed, it’s often assumed their intelligence can lead to similarly good results in other fields. Further, successful investors often come to believe in the strength of their own intellect and opine about fields with no connection to investing.  - "The Folly of Certainty" Oaktree Howard Marks 

Another relevant quote is associated with D McCloskey, which she calls the American Question,"If you are so smart why aren't you smart, and the retort, "If you are so rich why aren't you smart." See "The Limits of Expertise".

There may not be an association between brains and financial success. There is a minimum amount of intelligence that is needed, but there are other skills more important like tolerance for risk, the ability to be disciplined, and the ability to sift through many facts, or perhaps the most important skill of being humble and accept that you may often be wrong. 

Financial memory - memory loss is a problem


“For practical purposes, the financial memory should be assumed to last, at a maximum, no more than 20 years. This is normally the time it takes for the recollection of one disaster to be erased and for some variant on previous dementia to come forward to capture the financial mind. It is also the time generally required for a new generation to enter the scene, impressed, as had been its predecessors, with its own innovative genius.”  - J K. Galbraith 

Financial memory is an often-overlooked important issue. Think of those who started their career after the GFC. If the professional started in finance at 22, he is now 37 and has never seen a pre-QE world. If you started your career at 25, you are now entering your 40's without ever having seen a large bear market. Many quants create back-tests that are much shorter than 15 years. It is no wonder that leverage is a king, and many investors want to continue holding risky assets and buying on dips.

Tuesday, July 23, 2024

Should you prefer stocks or bonds? - Not an easy question


Inflation has come down and the bias form the market is that the Fed will cut rates in September and start the process of bringing down short rates. The advantage from holding cash will decline, so the question is whether those funds in cash should move into equities or bonds. 

If inflation is lower and growth is lower, the choice of seems to make sense, but the environment is not a given. Additionally, investors have to think about relative valuations. Stocks are, by some measures, expensive relative to bonds which tilts the decision in the direction of bonds.  The Sharpe ratio favors bonds, yet stocks will still do well, just less well than if the equity market is cheap. 

The bias seems to be in favor of bonds as the again the great diversifier; nevertheless, if the choice is expanded to alternatives choices like managed futures seem attractive. With trend-following you may be able to take advantage of adjustments in both stocks and bonds.


Being a Wall Street analyst has a lot of pressure, even today


Confessions of a Wall Street Analyst is an older book from 2007 which focuses on the telecom sector when it was going through massive changes. Several of the key people in the story were fined and went to jail and some of the high-flyers declared bankruptcy and engaged in fraud. This was before Eliot Spitzer went after Wall Street and new regulations stopped some of the practices that were standard on the Street prior to tech blow-up. 

Nonetheless, Confessions of a Wall Street Analyst gives a good account of the pressure on Wall Street analysts to produce and deliver on timely information and forecasts concerning earnings and industry developments as well as company strategy. The analysts have to keep their firm happy, work the buy-side, and constantly deal with the CFOs from the companies they cover. They do this is a competitive environment where every analyst is watched and rated. This is not an easy job. These fundamental analysts now must compete with quants who crunch all the numbers looking for outliers and AI which can review hundreds of pages of text. The pressure is on. Yes, the rewards can be great but not like twenty years ago; however, there is now a strong bid from hedge funds, another pressure cooker. 

Monday, July 22, 2024

Geopolitical risk is tied to inflation


Inflation has come down from highs, but prices are still higher than what was seen four years ago. The value of savings has been eroded and if you did not see your wages increase, your purchasing power has declined. In the paper "Geopolitical Shocks and Inflation", the author shows that there is a link between inflation and geopolitical risk and it has gotten stronger over the last two decades.  Geopolitical shocks lead to increases inflation.

The increase in geopolitical risk leads to a decrease in international trade and supply disruption which then is then related to higher public spending, public debt and increases in the money supply.  Geopolitical risk leads inflation which calls for policy responses that create second order effects. If there are supply shocks, there is higher inflation and a GDP drop. The type of policy response will impact the size of the inflation and GDP shock. 


The driver for some of the voting for political change may be associated with the increase in geopolitical risk and inflation. Geopolitical shocks impact inflation which then drives household sentiment.


Thursday, July 18, 2024

Why is the stock-bond correlation important?


Bonds have been the great diversifier relative to stocks, yet this relationship is subject to change and can move from negative to positive.  So, what does that mean for your asset allocation?

A switch from a -.5 to +.5 will double the volatility of a 60/40 stock/bond mix based on historical data. Think about it. You will see your portfolio can move from single to double digit risk while keeping the allocation the same. There will still be a diversification benefit from bonds, but you will have to live with more risk. Back to basics, the correlations across assets matter.

The evolution of markets is something to behold


John McMillan in his book Reinventing the Bazaar: A Natural History of Markets tackles a simple question how do market form and develop. McMillan hops around many topics and linked them together to form a cohesive story of how markets operate.

This book is not about the question of how markets are designed but addresses the simple question of what makes a market and why are markets so effective at helping with the allocation decisions in an economy. 

Matching buyers and sellers, the process of search, is not easy. Central planning has always found that the price discovery in markets and the matching of parties for mutual benefit cannot be just decreed. Still, markets form so that goods are bought and sold, and the right products are gotten into the hands of those who desire them. 

Markets, however, are more than just matching. They provide signals about products. It distributed information. Markets help others make better decisions beyond the immediate purchase. In a broad sense, no man is an island. A man's actions help others make better decisions. Nevertheless, rules and regulations are needed to have these markets run efficiently. 

The wonders of markets are not always perfect. There are inefficiencies and externalities, but the system works, evolves, and responds to new technology, tastes, and customs. The bazaar is truly a fascinating place.  

Trading chaos can be profitable but harder than you think


Chaos Kings tells the story of some Wall Street traders who focus on extreme left-tailed events, think Nassim Taleb and Mark Spitznagel who monetized the ideas behind Taleb's Black Swan events. It is a fast breezy read which makes the trading of tail events exciting even though the premise is that you place some extreme hedges through buying puts and then wait for the fat-tailed event to happen. Still, waiting for extreme requires patience and the ability to actively adjust hedges.

Chaos Kings is not a technical book. Rather it is story of how these chaos kings fought the establishment and with a radical idea that protecting extreme downside can create significant profits. This worth a read on unconventional thinking leading to success.

From the Fidelity report "Liquid alternatives: The power of equity options-based strategies", we can see the impact of having some put protection on the SPX.


Studying market design is critical


Alvin Roth, a Nobel prize winner in economics, has spent most of his career working in a critical area of economics which is often overlooked or taken for granted, market design. Market design represents the principles and rules that define or govern markets.  In his book Who Gets What - and Why, Roth presents the key concepts of market design in a very readable book with key examples. If the design is not correct, there will be market failure. 

Matching engines, the essence of market design, are only effective if participation is safe and simple, yet simple to use is not often simple to create. The wrong rules will create an imbalance between buyers and sellers who will then look for an alternative. Good market design allows for effective matching without congestion or bias. 

Think of all the rules associated with a futures exchange or stock trading. The centralized market allows for the better matching of buyers and sellers and the creation of liquidity. It is a place of price discovery and signaling if done correctly. A good market design can create a better market and eliminate inequities and inefficiency. We may think about exchanges, but design solutions can be created for matching kidneys donors with those in need, medical doctors with residences, or students with school choice.  The next time you think about a market, think about the design and how it achieves better or worse outcomes.  

Monday, July 15, 2024

More on the law of small numbers


Behavioral finance will help improve our understanding of how markets operate and how investors make decisions. Unfortunately, it will often generate competing hypotheses for different price behavior in asset markets that need to be reconciled. A recent paper attempts to reconcile the law of small numbers (LSN) with the disposition effect and trending prices to within a single model. See "The Law of Small Numbers in Financial Markets: Theory and Evidence"

The law of small numbers states that there is an incorrect belief that small samples will represent the properties of the actual population. This mistake may suggest that some managers will have a hot hand,  and it will also suggest that if there is a sequence of the same result there is a higher likelihood of a reversal to bring the sample closer to the population, the gambler's fallacy. Note that the law of small numbers can suggest either trends or reversals. If the investor knows the data generating process, it will assume mean reversion. If the process is not known, it is assumed that the few data positions can be extrapolated.  

The disposition effect states that investors will sell assets that have increased in value while holding asset that decrease in value. The disposition effect means selling your winners because you believe there will be a reversal from winner to loser and holding your losers because you believe that losers will soon turn into winners. 

Note that when you have a certain view based on the law of small numbers it may explain or reinforce the disposition effect. The behavioral error on the small sample leads to a behavioral error associated the disposition of assets, yet the law of small numbers can also tell us something about return extrapolation, trends. 

Investors will sell assets that have recently gone up because there is expectation that they will reverse, price changes will revert to the long-term population; however, they will buy assets that have gone up for a while, the hot hand. The overall result is that trends and reversals can be generated because of the law of small numbers. Additionally, the disposition effect will be more pronounced for shorter horizons than longer horizons. If you fall for the law of small numbers, you will have a stronger disposition effect and a doubling down in buying.  

The LSN investors assume a mental model that a risky asset has a quality term along with noise, and they can make some inference about this term over a small sample of past prices. If the noise is negatively autocorrelated, then you will get the gambler's fallacy and expected price reversal. If the quality term is positively correlated than you get the hot hand. This type of model can be applied to describe the characteristics of investors, negative beliefs about short-term performance and extrapolative beliefs based on longer-term price behavior.

These are very interesting traits for individual investors and may show-up with aggregate pricing behavior. You may not trade upon this information, but you can ensure that you do not fall prey to the law of small numbers or the disposition effect.  

Can this help with trend-following? It may not tell you when you can make money, but it provides another explanation for why trending in prices may occur. LSN investors can drive aggregate price behavior. 

Friday, July 12, 2024

ML models for equity returns are business cycle dependent


Machine learning is being viewed by many as the solution to all forecasting problem. The initial evidence from several studies is positive but the computing costs and the barriers to entry for using these models is high. It takes work to implement ML programs. A new study focuses on forecasting skill of ML models of the SPX index but decomposes performance between recession and non-recession periods. The paper finds that performance decreases during recessionary periods especially when volatility is higher. 

This is unfortunate, yet is should not be surprising. Recessions are not frequent, in the data set tested there were seven recessions, so the periods for training models during recessions are smaller. If you don't see the phenomenon, you cannot model it. This applies to all modeling. We also know that parameters may change during recession periods so using relationships during normal periods may fail. See "Stock Price Predictability and the Business Cycle via Machine Learning"

The authors use recurrent neural networks which include Long Short-Term Memory (LSTM), bidirectional LSTM (BLSTM), and gated Recurrent Unit (GRU) model as well as multi-layer perceptrons (MLP).  The models that have macro variables that account for recessions and expansions in the economy show some improvement especially during periods of expansion. As has been noted, equities often bottom before the trough in growth and then start to rally while the economy is still in recession. Just identifying recessions may not be enough.

Recessions are just different and harder to model.  Just because you think you have a good model does not mean you are ready for recession.


Thursday, July 11, 2024

Commodity return prediction and intertemporal pricing


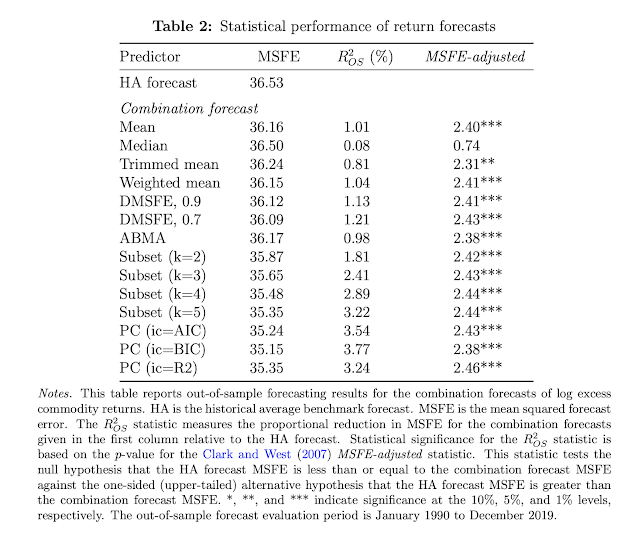
The paper "Commodity Futures Return Predictability and Intertemporal Asset Pricing" is another study that connects macroeconomic behavior to commodity returns. If you track key variables that proxy for the business cycle, you will be able to generate significant out-of-sample returns. These predictions are structured in a Merton-type inter temporal asset pricing model which is consistent with theory.

The authors form combination forecast of 28 potential predictors that add to Sharpe ratios across a broad set of commodity markets. Several combination methodologies are used with the predictors to form a forecast for future economic activity which is then combined in a regression with the market risk factor. The combination approach allows for a better representation for what future economic activity will be than single predictor or a regression with multiple predictors. This makes for a complex set results, but the overall conclusions are consistent with other work on this topic. 

Tell me something about the real economic and I can tell you something about commodity excess returns. The study focuses on two-factor models which combines the market factors with innovations from the real economic combination forecasts. The work is consistent with the expectations from an inter-temporal asset pricing model (ICAPM). Given the focus on ICAPM, the models include factors that would also be associated with other asset classes. As with other studies conducted on predictions of commodity excess returns, macroeconomics variables and risks are key determinant for commodity returns forecasting.  Of course, the R-squared for these forecasts are very low, under 5 percent, but the values are still economically meaningful. 

What this work suggests is that even some simple macro adjustments to a commodity return model will provide value-added that is greater than just using past excess returns.


Wednesday, July 10, 2024

More on commodity returns and macro drivers - Use the forward curve


The paper "Commodity Return Predictability" combines the basis and forward curve with macro variables to make effective predictions on commodity returns.  We know that when commodity markets are in strong backwardation or contango the future prices have important information that can be exploited. If the commodity curve is inverted, in backwardation, current prices are higher than future prices and the curve suggests there is strong commodity demand. On the other hand, if the market is in contango, current prices are lower than future prices and there is likely less current demand. This current demand is also related to the business cycle and suggests that commodity price moves are pro-cyclical. 

The author of this paper shows that combining the shape of the forward curve along with macro information can be effectively used to explain commodity returns both in-sample and out-of-sample. It is not enough to just look at the basis over one month, rather it is more valuable to look at the whole futures curve and account for the level, slope and curvature of this forward curve just like the yield curve. A close look at the data will find that the curvature of the forward curve provides strong added information. Forward factor regressions have been used to show that the shape of the yield curve can be used to predict bond returns, so the same methodology can be applied to commodity forward curves, and it also is effective. The key is looking at the longer-dated basis and not just the nearby futures. 

Additionally, the shape of the curve and the basis is related to the business cycle, so factors that account for the business cycle like, industrial production, the composite leading indicators, business confidence, and trade will also have an impact on commodity returns. What is very interesting is that the out-of-sample forecasts with macro variables alone are not very effective. 

Finally, the author tests some other variables known to have some predictive power from past tests and finds the growth in open interest is also a useful predictor. If the futures are being used to hold position exposure, it is a sign that returns are moving higher. 

The combination of endogenous information embedded in the yield curve along with exogenous macro information, especially in the case of composite leading indicators, will be a useful for making commodity return forecasts. Nevertheless, there is a concern that the majority of the forecasting gains are associated with the super-cycle extremes of 2008. The gains during other periods are more modest. 


Tuesday, July 9, 2024

Classifying hedge fund strategies once again


New paper by GIC and JPMorgan Asset Management provides another classification for hedge funds. See "Building a Hedge Fund Allocation: Integrating Top-down and Bottom-up Perspectives". Investors expect several specific yet not mutually exclusive characteristics from their hedge fund portfolios:

  • Returns with low correlation to equities
  • Capital preservation during equity market drawdowns
  • Alpha or excess returns above a market benchmark.
If you want to obtain more diversification, pick managed futures. All the managers in this category have correlations that are below .5 and almost half have negative correlation with equities.


Managed futures also does well when making comparisons with global drawdowns. It and global macro are the only strategies that have positive returns, on average, during drawdowns. 

It is not guaranteed that managed futures will generate positive performance during drawdowns; however, the likelihood is much higher than other strategies.

The alpha from managed futures is positive and strong versus other strategies and it delivers a much lower beta than other hedge fund styles. 


The study identifies four major strategy buckets and finds that the loss mitigation strategies have low correlation with equities, high alpha, and high returns during periods of stress which makes for a great addition to any portfolio. Loss mitigation managers are a good diversifiers relative to other hedge fund styles. 


Commodity returns and macro drivers - business cycle and inflation


What drives commodity prices? This is an age-old question addressed in a paper which has looked 140 years of history across a wide set of commodity markets in the energy, agricultural, and metals markets. Their results are consistent with what you think if you applied business and monetary policy thinking. Industrial production and inflation are the two most important variables for predicting commodity returns. Track the business cycle and inflation and you will have some predictions for commodity returns. See, "Predictability in Commodity Markets: Evidence from More Than a Century".

Different commodities have variable sensitivities to macro data. Agriculture and metals are sensitive to industrial production, yet the energy complex is not sensitive to the business cycle. Commodities in general are sensitive to inflation.  Many of the factors tested are significant for in-sample tests but lose their significance out of sample. Commodities are more predictive during the business cycle expansion relative to a contraction.

Volatility can also be predicted, but not for agriculture out of sample. The general high volatility and seasonality for agriculture may be the reason for this poor predictability.

The overall number suggest that some macro variables can be linked with trend to improve commodity trading.


Mr Momentum driving stocks - but unlikely to last


It is the year of momentum (last 12-months). You have to go back to 1999 to see the same type of concentrated momentum. Now we know that this is concentrated in technology and specifically the Mag 6, but that does not change the fact that holding momentum has been the best strategy especially versus the fully diversified equal-weighted index.

Party like it 1999 because it is likely that this momentum environment will not last. We don't want to be trapped by the law of small numbers, but it seems as though these factor extremes will have to adjust or normalize. We are still in a high interest rate environment which should suggest a tilt to quality or value. 


Monday, July 8, 2024

The jury is out on LLM for time series forecasting


Large Language Models have all been the rage in data science and has been an area of focused attention by many in finance, yet it is less clear whether these models provide added value versus other techniques for forecasting time series. Now we have some evidence on their viability and the results are not positive. See "Are Language Models Actually Useful for Time Series Forecasting?" This is not an easy paper to read because it requires a fair amount of key knowledge about ML and LLM models, yet the extensive analysis is strong evidence that LLM may not be a solution to time series forecasting. 

The researchers test times series data across a wide spectrum and run ablation tests that find that dropping the LLM component will improve the quality of forecasts. Obviously, different researchers will generate different results based on their implementation of the techniques, but this study places the burden on the LLM community to show why LLM will be better than simpler and less costly approaches to forecasts. 

Saturday, July 6, 2024

Every Man a Speculator - A fun read on financial history


Steve Fraser's Every Man A speculator: A History of Wall Street in American Life is a fun book that provides color about the characters that have driven US financial history. Rogues may be a better word than characters, but it gives the reader a deep history about the culture and people that populated Wall Street throughout our history. Fraser is a great writer, but this history could have been shorter and more focused if it wants to reach the average reader.  It is supposed to be about American life, but the focus is more directed to personalities and not about how Wall Street impacted cultural thinking. The life component is there just not always front and center. Nevertheless, the writing is memorable:

"In 1929, the raucous staccato of ten thousand ticker-tape machines had provided the jazzy accompaniment to Wall Street's fandango. Only two thousand machines were left by 1941, their rhythms slowed as the street grew quiet, almost inaudible to the American ear." 

On the corporate raiders of the 80's 

 "...at least they worked like demons to get it, putting in inhuman hours, beginning their days at four in the morning, ending them at midnight. For them, hard work, an American sacrament, was an aphrodisiac, a living reproach to the stereotypical Wall Street banker whose day began at ten and ended at three with an intermission for a three-martini, two-hour lunch. "

Friday, July 5, 2024

Keep it simple with realized volatility forecasts


One of the key risk management problems is forecasting volatility. A key issue for any option trader is forecasting volatility. You cannot do either without good volatility forecasts. So how do you get good forecasts? The Machine Learning (ML) crowd will say that you should use the latest non-linear techniques to improve forecasts. This view assumes that more complexity is better than a simple model, yet this is an assumption that should be testable. 

In the paper, "Forecasting realized volatility: Does anything beat linear models?", the authors compare different tests on the quality of linear and non-linear ML models for forecasting realized volatility. They conclude that heterogeneous autoregressive (HAR) models should remain as the workhorse for forecasting volatility.  The HAR models generate a volatility forecast using past volatility across different horizons. The ML techniques include neural networks as well as tree-based methods. 

They find that adding predictors will improve the out-of-sample forecasts for short-term forecasts, but there is no evidence that ML models can outperform the linear models. The models are tested against MSE, one-day ahead VaR, and realized utility. Simple works well and forecasting realized volatility does not need the added work from ML procedures.


Volatility targetting is trend following for equities


Volatility targeting outperforms a buy and hold strategy, but why? Volatility targeting is the process of adjusting risk exposure or leverage to set a specific volatility level. Usually, managers set the leverage and allow the volatility to move.  

Volatility targeting works because there is a negative correlation between return direction and volatility which has been called the leverage effect. Volatility targeting will be negatively related to the magnitude of recent returns. Given this relationship, we can say that volatility targeting has a trend following effect. The relationship between volatility targeting and trend-following was explored more closely in recent research paper, see "Volatility Targeting is Trendy: How Trend Following Explains alpha in Volatility-Managed Strategies". The leverage effect is not present with bonds, commodity and currencies.  If you control for trend-following the alpha from volatility targeting will decline by about 2/3rds when tested against a portfolio of 14 stock indices. The volatility targeting link to trend-following does not occur with other asset classes. 


Mixing trendfollowing with global macro - A good combination


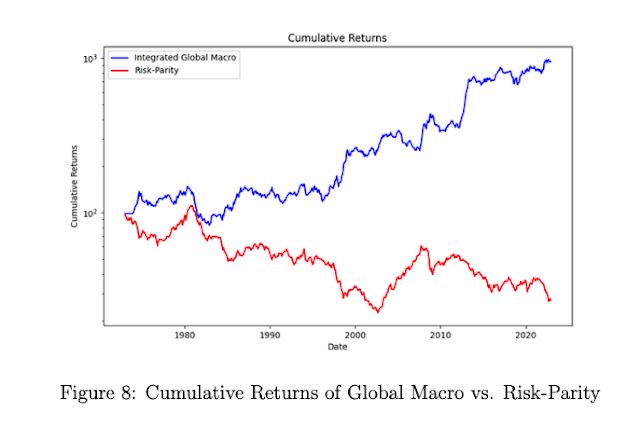
The combination of trend-following and global macro seems to have significant merit. These two strategies complement each other because their signal generation is different.  The work of Aidan Vyas in "Evaluating the Performance of Systematic Trend-following and Global Macro Strategies" develops two strategies and the shows their distinctions and areas for benefit. 

Vyas looks at a broad set of countries and asset classes across stock indices, bonds, currencies and commodities and employs GDP growth, inflation, interest rate as a policy indicator, and real exchange rates as key economic indicators within a risk parity framework. Trend signals are based on risk -adjusted cumulative return for three different timeframes (1, 3, and 12 months). The global macro signals are based on the trends in the global macro indicators.

Global macro alone is not much better than a risk parity, but if you add trend and macro, you get a better Sharpe ratio and lower volatility. The macro approach is simple, but it does suggest that diversification of strategies works.