Monday, July 31, 2017

There may be a crash, but let's not get ahead of ourselves


Financial crashes are rare events, but these rare events have direct impact on any risk assessment, the pricing of risk assets, and portfolio structuring. The impact of these rare events is through the probabilities that investor may associate with them. If the price of any security is the discounted value of future prices times their probability, a higher weight for negative events will pull down expected prices.

There can be a significant impact on performance if the probability assessments for rare events are wrong. If rare events are under appreciated or given too low a probability, risky assets may be over-represented. Similarly, if a risk assessment is given too high an assessment, money will be left on the table because risky assets will be under-represented in the portfolio.

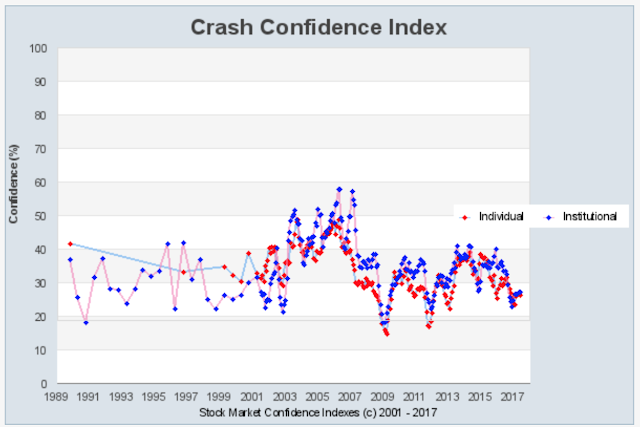
A paper written in last year is especially relevant in today's market where the talk of a market crash seems to be increasing with every movement up in price.  See "Crash beliefs from investor surveys", by William Goetzmann, Dasol Kim, and Robert Shiller. This paper uses time series survey information from a simple question: 


The results show that investors place, on average, a probability of approximately 20% to the chance of a rare case event in the next six months. This is an odd assessment given the actual probabilities are more likely to be less than 1 percent. It seems too high relative to actual occurrences.

So what could cause this crash assessment to be so high? The authors conjecture that it is associated with news about crashes. If there is more news or reporting on bust, crashes, and bad news, there will be a higher assessment by investors that they will occur. This could be part of a bias by investors. Without sarcasm, if it does not seem rational, it must be a behavioral bias. The behavioral bars of availability would suggest that if there is more information available about a negative event, there will be a greater likelihood that investors will increase there probability of a crash.

The current numbers from the Yale International Center for Finance show that crash risk is higher than expected relative to the actual data, but is lower than the expected probabilities over the last few years. It will be interesting to see if this number increases quickly in the fall.


Crash risk has been high throughout the post Financial Crisis period, yet there has not be a crash. There have been mini or flash crashes based on electronic trading, yet nothing has met the criteria described in the question. Could the fear of a crash been keeping investors on the sidelines? The research question that has to be addressed is translating what investors say into what they will do.  Additionally, as this paper points out, confidence can be swayed by news and opinions of others. This feedback loop is critical for understanding market behavior.


Saturday, July 29, 2017

How many asset classes are necessary for asset allocation? No one may know

Here is a simple question that should have an easy answer. Name a universal set of asset classes that can be employed to categorize the investments for a large university endowment. The answer to this question may astound you. There is no agreement on the number of asset classes an endowment should have in order to make asset allocation decisions. That's right, the largest university endowments cannot agree on this basic number for how to categorize investments. See the paper, "The evolution of asset classes: Lessons from university endowments", Journal of Investment Consulting Vol 17, no 2, 2016.

The median number of categories for a group of leading endowments surveyed in the article is 6 with a maximum number of 9 and a minimum number of 4.  This breakdown is for a set of 29 as shown in the figures below that represent just over half of the endowments included in the research study. With all of the education and discussion about the simple question of how you should bucket securities to make asset allocation decisions, some of the largest university endowments show no commonality concerning this number. However, this just scratches the surface with many other endowments producing deeper granularity and other universities forsaking asset classes and focusing on factors and asset classes.

An asset class should have some simple characteristics. It should be definable, have something that can serve as a benchmark, be uncorrelated with other asset classes, and understandable. Even this simple categorization can lead to arguments. Are international equities a separate asset class? What about private equity? What about emerging markets or hedge funds that focus on equities? If we move to fixed income, there are simple questions of whether government bonds should be separate from credit. Is cash different than bonds? Should real estate and commodities be separate or combined as a real assets? The question of how to divide hedge funds is another definitional trap. How many hedge fund categories are appropriate? Many focus on long/short equity and all else. 

The impact of these choices is real especially with less exposure focused on equities and fixed income. If asset allocation decisions and performance monitoring is to be done effectively, it seems such a simple question as setting the right buckets should be universally addressed.  Are more categories better than less?  Of course, the real issue is whether this should matter. If I have fewer or more categories for classification will this help generate better performance? That critical issue still needs to be answered. 


Algorithm aversion or just a desire for low cost optionality?

Investors have had an aversion to using models, but that may be changing rapidly. More money is being managed by systematic managers or focused on some form of smart beta or a set of rules to investing. Nevertheless, there has been documented fear from letting go and having a model make decisions. 

We have written about the problem of algorithm aversion a few years ago, see our post "Algorithm aversion and managed futures", but we just saw a nice discussion on this issue from Ewan Kirk, the CIO of the systematic manager Cantab, see LSE Alternatives Investment Conference - Algorithm Aversion. The problem of rules avoidance is still perplexing. Why do investors prefer discretion over a rules-based approach even though the rules-based approach may perform better?

I like rules. Rules and models are good and their value is well-documented, yet many do not want to follow them. Thinking about this issue, the aversion to rules may be related to the price of optionality associated with switching the decision process or dropping an algorithm. Individuals may not have an aversion to a model but aversion to binding behavior or a lack of flexibility. 

Rules or using models are binding on choice. There is less choice or optionality with a decision when a specific set of rules is employed. If given a choice between a model and discretion which allows for flexibility, an individual may prefer the path that allows more flexibility or discretion. This is especially the case if the flexibility is available for free. The issue or question should be the cost of the option for flexibility. Since you may not pay directly for the option of flexibility, the reason you would give up flexibility is if the choice of flexibility is more expensive versus constrained behavior. 

The reason for choosing an option that binds behavior is that the inflexible algorithm is superior in performance relative to the discretionary flexible choice. The relative difference in performance will determine the price for maintaining flexibility. If flexibility is painful or costly, an investor will more likely bind to a rules-based approach. Now, the research suggests that individuals place more negative weight on model uncertainty even if an algorithm does better overall than discretion. This suggests that the pricing of choice (binding versus flexibility) is not easy to measure. More research should be conducted in this area.

In some sense, the switch to passive index or rules-based investing versus a discretionary active approach is driven by the fact that rules do better and the evidence of this quality is increasing.  The cost of the option for flexibility is high (under-performance). If systematic managers under-perform, investors may opt for discretion over switching to another algorithm. The cost of having flexibility (discretion) is low when rules do underperform. When the cost of having flexibility (discretion) is high low performance, the switch will be to algorithms. The cost and uncertainty of flexibility will drive the aversion. Unfortunately, the analysis shows this process to be fairly complex.  

Friday, July 28, 2017

The hazard of experts - How do you avoid this hazard effect with hedge fund managers?


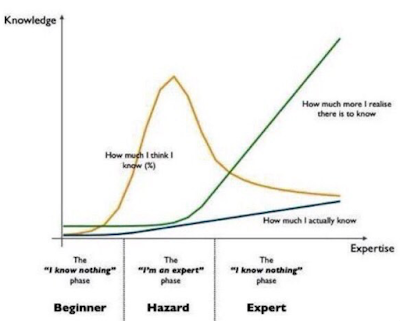
There is a well know cognitive bias called the Dunning-Kruger effect whereby individuals who perceive themselves as experts will have the illusion of superiority concerning their cognitive abilities. They believe their own talk. They are experts, right? 

Some just call this confidence, but it seems to be a trap for investment managers who cannot admit how much they do not know. It is also a trap for investors when they pick managers who seem very confidence in their abilities to make money. You want confident managers, but how confident? Now, more confident traders are less risk averse, but they may also be prone to bigger errors and are more likely to hold onto losers since they will not admit failure. The confidence of toady could be the big loss of tomorrow.


So what does an investors do when conducting a due diligence on the skill of the manager to determine overconfidence? On the one hand you want to have a expert running your money, but the true expert is more likely to tell you or admit what he does not know, or at the minimum, create a sense of uncertainty and doubt about some of the actions that he will be taking. On the other hand, the manager who is very confidence, in command of many facts and figure, provides strong details on how much he knows, may be a hazard with a blow-up just waiting to happen when there is a market surprise. Where is the middle ground between confidence and doubt?

The extremes are obvious. The manager who does not express any doubt should be avoided, a clear hazard. The manager who raises self-doubt on key questions and questions the meaning of figures could likely still be a beginner. The question is how do you get information on the manager who can combine true knowledge with the awareness of the unknown. This cannot come from just looking at the numbers. A good track record is combination of skill and luck. There has to be a qualitative judgment.

This is where scenario discussion works well. The classic question combination, "Tell me about your best trade and worst trade in the last year" is a good start. If there is not humility and admittance that luck played a role in the best trade, avoid the manager. If the manager does not admit that he missed something in his work on the worst trade, avoid the manager. 

However, the follow-up questions are critical to determine skill and luck. In the case of the bad trade, the self-awareness of what went wrong is critical. What specifically did the manager miss? Have the manager give the details and why it was missed. How is this missed information now being incorporated in the investment process? In the case of the good trade, what made the manager lucky? The good trade could have right for the wrong reasons. The direction could have been right but the magnitude of the impact could have been wrong.

The critical job of the due diligence analyst is to overcome the uncertainty from the Dunning-Kruger effect. This process is especially difficult in global macro trading and model building, so extra care should be taken with these manager reviews. 

Thursday, July 27, 2017

Is it worth trading both Euro STOXX 50 and 600? Country and capitalization plays


Is it worth trading two highly correlated equity indices? The correlation between the Euro STOXX 50 and 600 is generally above .95, so most would argue that the two are interchangeable.  There is a significant difference in the volume of each futures contract, so liquidity may not be the same. Hence, some would argue that it is reasonable to choose one, but a closer look will show that there are spread opportunities across the two indices no different than the equity spread opportunities in the US based on size or industry mix. Spread trades in index futures offer a way to increase the opportunity set of returns in ways that are often uncorrelated with traditional directional bets.


The Euro STOXX 50 is a megacap index of the largest funds in the Eurozone. The average capitalization of the firms in the index is 46.6 billion EUR versus 13.7 for the total market index. The index presents about 60 percent of the overall free-float capitalization of the broader Euro STOXX total market index. France and Germany represent just under 70% of the index market cap with banks and industrial goods representing 25% of the market exposure. An investor is getting a portfolio of mega cap names which have global presence.

The Euro STOXX European 600 index includes the largest 600 names in European and represents about 92 percent of the free float total market capitalization. The country mix will be include Great Britain, France, and Germany, as the largest country exposure at about 60 percent of the market capitalization.  Banks and health care are the two largest sectors at about 25% of the market capitalization.

The recent return performance over the last shows the Euro STOXX 50 ahead of the 600 based on the difference in country weights. However, we can see this switching again if there is less BREXIT uncertainty or there is a switch to more growth in Europe versus the rest of the world. There will also be switching opportunities based on the effects of business cycles and smaller size firms. These may not be exploited through an approach of holding a single index representing "European" exposure. There are additional opportunities associated with trading country versus basket trades. While many of these opportunities are well-known, there may greater chance of exploitation as central bank policies change and we move further through the post financial crisis environment. As correlations among stocks decline the return dispersion in these indices should increase. 

Wednesday, July 26, 2017

The incredible shrinking alpha - Falling skill or alternative definitions?


The beta battle of what portion of returns can be explained by systematic factors continues across the asset management world. However, it is not so much a battle of performance breakdown between beta and alpha skill but of definition. What used to be called alpha in a simple one-factor world can now be partially described as a beta. The alpha manager of yesterday is partially the alternative or smart beta manager of today not by design but from construction. The incredible shrinking alpha is associated with the incredible growing betas. 


We focus on the changing definition of alpha by looking at a simple graphical depiction of how returns have been decomposed into different betas (factors or risk premiums). In an old hedge fund world, the total returns were viewed as the skill of the manager. From this simplistic view, there was the advancement into the market beta view where returns could be decomposed into market beta and manager skill or alpha. In this advanced world, alpha has fallen and there is a discussion on whether investors should pay for beta. 

We are now in the alternative risk premium world which states that hedge fund returns can be further decomposed into a market and assorted risk premiums like value and size to name two of the most common. The alternative betas can be further decomposed into carry, momentum, or defined factors. As more "betas" are used to describe hedge fund returns, the alpha based skill is further shrunk. Of course, there may be skill navigating and weighing different risk premiums but that is a different discussion.

The result of more betas is a shrinking alpha that can be attributed to manager skill. It is not that managers have gotten less smart, but investors have gotten smarter at defining what are appropriate betas. The skill of managers could actually be increasing through time after accounting for all the appropriate betas. This issue defining the betas in a fund is actually complex and skill identification has gotten more nuanced.   

Monday, July 24, 2017

A simple taxonomy of diversification - All diversifiers are not alike


When I hear about diversification across funds or strategies, I, like most investors, will immediately focus on the correlation matrix versus other alternatives and asset classes. However, investors should be thinking beyond the simple historical numbers and focus on forward expectations for correlations. There should be views of how diversification may change through time or behave under different scenarios. To form diversification or correlation forecasts, investors should have a classification scheme for diversification. All diversification is not alike and a classification scheme may help with determining how correlation may move. 

For example, if an investor asks for a strategy that has diversification to protect in a crisis, they have embedded a forward view of what they would like to see the correlation to look like under an extreme scenario. There are also placing a weight on the likelihood of a crisis that may drive a correlation disruption.

More generally, the correlation of an asset class or a fund is based on the sensitivities to different factors or risk premiums. A simple taxonomy of diversification could breakdown a market, manager, or strategy into five different types or buckets. The easiest diversification classification is an asset class. However, asset class correlation can change with the business, cycle, investment flows, and in a crisis. The simplest and perhaps best diversification currently is the negative relationship between stocks and bonds; however, there have been long periods when this correlation has actually been positive. Any diversification strategy has to account for the fact that the negative stock bond correlation is not definitive.

A second type of diversification is based on factors.  Factor-based diversification is often confused with alternative risk premiums. Our view is that a factor could see some macro variable or characteristics that been be correlated to an asset class, market or strategy.  Simple examples of a factor-based diversification will be sensitivity to inflation or economic growth.  The alternative risk premium diversification may include sensitivities to value, size, term premium, or credit to name some classics. Some of the have proved to move and out of favor.

A separate category of the asset class/factor/risk premium diversification is the crisis alpha type of strategies which have low or negative correlation during "bad times". These scenario-based diversifiers could be safe assets or a strategy that will take advantage of market turbulence or diversification.

A final type of diversification is from those managers who are alpha producers or who focus on short-term strategies that will not be dependent on the overall longer-term direction of a market or risk factor. I will call this skill-based diversification. It can be hard to find but may prove stable relative to many forms of diversification based on macro factors.


This taxonomy just scratches the surface on an issue that if fundamental to asset allocation but is critical to an attempt to maximize portfolio return to risk. While portfolio diversification has often been called the only free lunch of investments, this freebie can be enhanced through some thought on the form of diversification across scenarios.

Saturday, July 22, 2017

Managed futures in a drawdown - How bad is it? - Take a look


The managed futures hedge fund strategy, as measured by a well-watched peer group index, is in a major drawdown. In spite of this, money is still flowed as investors have taken a forward looking view of what this strategy will do if there is a sell-off in major asset classes like equities. 

Of course, indices do not represent the behavior of individual managers within this space. There are winners and strategies that have made money over the last two years. It is just that the search may be a little more difficult because many big names which focus on longer-term trends in financial markets have had fewer profitable opportunities. In general, better diversified managers across style, timing and markets have done better.

Our first chart shows the value of the SocGen CTA index since inception with a trend and quadratic line fitted through the index values. There was a clear fall below trend in 2016 which has accelerated.

The actual drawdown is at an index maximum beyond 12%. There have been 10% plus drawdowns in the past; however, those have been in periods of higher market volatility. A quick analysis shows that the amount of time that is spent at high water marks is usually low, about 20% of the months, and the amount of time beyond a 7% percent drawdown is also low at about 20%. Getting to this drawdown was not unusually fast albeit the last year has been shown a strong trend.
We also looked at the index using a rolling 24-month linear trend model which provides some deeper visual insight on the current down trend. It is steep with the inflection point in early 2016.  The one step ahead forecast from the linear trend can be used to see how managed futures have deviated from recent trend. The data show that current poor performance has been much stronger than the down trend and unusual relative to past linear forecasts.

For those that have invested in managed futures, the last eighteen have been difficult but from a forward looking perspective the likelihood for either a disruption in equity or bond markets has increased and the likelihood of a further drawdown based on current strategy volatility is lower. Drawdowns are path dependent. Hence, the past history is relevant yet expectations of potential market turbulence may be more important for current allocation decisions.


Friday, July 21, 2017

Cost of liquidity - The hidden management fee that needs to be calculated


Investors are looking closely at the fees being charged, but the hidden fee of liquidity may be the most significant cost that is often not talked about. Large firms that are charging less may have higher costs associated with liquidity than small firms. As the size of the firm grows,  the cost of entering and exiting may be higher. Additionally, some markets that may offer opportunities are avoided because the cost of trading when liquidity is lower is higher.

There are economies of scale for managing a hedge fund business as a firm grows, but there are potential diseconomies of scale associated with the investment management of the business. You may get firms to be much more competitive on price as the assets under management grow or as it prices a large new inflow, but there may also be higher investment costs with running the money. One way to combat this higher liquidity cost is to increase expenditure and resources on trading and execution algorithms.

As firms get larger or price based solely as a management fee there may be the potential for misalignment of incentives and hidden performance costs. Larger firms that have covered fixed costs could easily focus more on incentive fees but it seems merely likely they will cut incentives and actually skew toward locking in management fees. 

There is a trade-off between the benefits from scale through risk management, research, execution, and business cost savings against the costs of liquidity management. There will be a point where the added net return from scale is outweighed by the performance drag from liquidity shortages.

Nevertheless, the cost of liquidity is extremely hard to measure because when you need it, it will not be available. The inflection point between economies and diseconomies of scale is hard to determine. So a natural question is, "What is the capacity of any given firm?" and "What is the capacity for a given strategy or across all firms pursuing the same strategy?" 

It is surprising that more firms have not closed to new investments as they have grown. It is likely most firms are optimistic and gauge capacity on the high side. Additionally, back of the envelope calculations on trading across firms suggest that many trades can easily be considered crowded. Discounting the uncertainty of liquidity is more important than calculating the discount or savings from lower management fees. 

Wednesday, July 19, 2017

It's a electronic futures world - Now what do we do? The changing role of brokerage


Automated execution is taking over futures markets. Actually, the battle is over. Voice (non-electronic) and manual execution are reserved for illiquid products, old school firms, smaller traders, those who may be undertaking spreads, complex legged or option strategies, roll strategies, and some block trade. However, the use of electronic trading can vary by market and sector. Technically, we are referring to manual (MAN) versus automated (ATS) trade execution where automated is generated and/or routed without human intervention. Non-electronic would be a separate category. By far, automated to automated trades dominate most markets even in many commodities.  The high frequency automated traders are the new market scalpers. Financials have a higher percentage of automated trading over commodity markets.

From the latest CFTC research, (see Automated Trading in Futures Markets by Haynes and Roberts), we have a graphical analysis of the ascent of automated trading across many markets. Some markets have seen slower growth but the direction is all the same.

What does this mean for the brokerage world? The overall theme is that relationship brokerage has come to an end. We define the old world of relationship brokerage as an environment where brokers provided access to execution services, generated trade ideas and execution strategies for working an order, and market color from what they were seeing in the market. The new world provides easy market execution services and connectivity at low prices, but there is limited interaction between users and brokers concerning trade ideas and market color. The fee and service of a broker relationship with a client is broken. For many who did not need the relationship services, this is a good thing. You get anonymous wholesale execution and low prices, but for those that need support for market analysis, the service is not present. 


I make no value judgment when I say the world has changed. Pricing for brokerage is sharper, but information flows may be worse. Information flow and color has always been a two-edged sword. The color you receive on the behavior of others comes at the price that your information may be seeping to competitors. Nevertheless, market anonymity causes fragmentation, uncertainty, and potential volatility at extremes. There is more unknown about competitor actions. In the new world, there is still a need for information flow, color, research, and execution services. It will just have to come through some other conduit.

Monday, July 17, 2017

When markets disrupt so does performance - June managed futures and outliers


What kind of month was June for CTA's? Well, you can look at the distribution plot of returns for the month to get an idea of the extremes. We created the QQ plot for the 377 firms that reported to the IASG database for June as of last week. This can be done for smaller more specialized samples, but we took the maximum set of data reported to IASG. 

A QQ plot is a comparison of the quantiles of a set of data to test the distributional properties, specifically its uniformity. A uniformed distribution, like a normal, will find data on the straight line. 

It was a bad month for many CTA's with much larger than expected loses and with a negative skew or tilt, yet there were some clear winners for the month. The power of diversification and the wide choice among managers shows that not all CTA's are alike even within some standard classifications. Some of the big winners were associated with commodities which did not suffer from the whipsawing seen near the end of the month in equities nor the change in bond direction. Bigger losers were those firms focused on trends in financials. Interestingly, many of the poor performers were also hitting max drawdowns. While more formal distribution tests reject normality, the performance numbers were often consistent with 10% annualized volatility, but a locational mean that was much lower than expected from historical averages. The spread was expected, the average was not, and a few headline at the negative extreme. 

Sunday, July 16, 2017

Suffering from regret in the hedge fund world - A problem for all investors


We have learned from behavior finance that one of the key thing that investors do not want to suffer from is regret. From prospect theory, there is a desire to sell winners and hang onto losers in order to avoid regret not suffer from loss aversion. Loss aversion tied everywhere to the decisions we make. Picking the wrong manager. Picking the wrong strategy. Picking the wrong time to enter or exit a trade.  Investors do want to make a decision only to find out that ex post it was a poor one.

So when will regret be greatest for hedge fund strategy decisions? It should be tied to the dispersion in returns. If there is a wide spread between the best and worst strategy, there will be greater regret that the action taken could have been wrong. Similarly, there will be more loss aversion or regret for strategies that bounce around from the best returns to the worst. A hedge fund strategy that has more change in their strategy rankings may need higher returns to entice investors to hold given there may be regret. 

We have looked at the dispersion of returns in the Eurekahedge data base of hedge fund strategies from 2000 through the first half of 2017 to get some idea of the dispersion in performance and the potential for regret.


The maximum and minimum of hedge fund strategy returns have declined since the financial crisis. The minimum returns for strategies have hovered around zero and the maximum has fallen closer to ten percent. The dispersions of hedge fund returns across strategies have fallen over the last few years, but the important number is the wider dispersion if there is market turbulence or a crisis. Picking the right hedge fund strategy becomes all the more important when equity markets sell-off and there is a increase in correlation across asset classes. 

However, the data get very interesting once you move to strategy specific analysis. We conducted a simple analysis by asking the question, "How many times is a strategy the best performer or the worst performer in a given year?" We are looking at nine strategies over 17 years, so there are a total 34 best and worst events. All things equal, there is a 1/9 chance that a strategy will be worst in any given year. Clearly, more volatile strategies are more likely to be the best or worst, but we want to focus on the potential for regret. 

If you pick the best what is the likelihood of that strategy being the worst, or what is the chance of being the worst for any hedge fund choice. This can be explored more deeply, but I present just the counts for best and worst. The winner for most times being at the extreme is managed futures followed by distress. Four strategies have three times been the worst. Only managed futures had been five of seven times the worst performance strategy. Distressed followed by managed futures had the most frequent number of best strategy performance. 

Given the extreme good and bad performance for managed futures (CTA's), there may be a wariness by investors relative to multi-strat or macro which are more likely to always be in the middle of the pack with performance. A focus on regret is real given the chance to end up "wrong" with a strategy choice.

Using hedge pricing as a weapon - The firms with scale will squeeze smaller firms


The idea that hedge funds are getting 2/20 for management fees is becoming a myth. Dynamic pricing is being used more aggressively by hedge funds with a wide range of management and incentive fee options. For example, in the managed futures space, there seems to be a willingness to offer beta products as low-cost alternatives as well as traditional alpha plus beta products. The low cost products are being marketed as trend-following beta at low cost while higher priced products are being offered as alpha generators relative to trend-following beta. Of course, there is not a clear definition for what is trend-following beta so there is something more going on with this pricing. (The beta may be associated with a peer index, so the beta firms offer a low cost product to match a bundle of competitors.) This approach is being used by a number of larger firms.  

Since smaller firms have been shown to perform better than larger firms, lower fees by large firms help to cut the return edge associated with smaller firm. Secondly, lower fees after fixed costs are covered will create a barrier to entry for new firms who have to grow to break-even. Lower fees will mean a higher break-even AUM is necessary to turn a profit. As the break-even level of AUM is raised, marginal firms are forced out of business unless they can consistently generate incentive fees to cover fixed costs. Additionally, it will harder for smaller firms to charge premium prices if the market fees are moving lower. This approach is extremely disruptive to the market structure as we believe that this pricing is being used more and more as a weapon to stop entrants and create barriers to entry. Now some of this pricing is not conscious action since for large allocations the investor sets the price, but changing the product mix, a willingness to negotiate prices, and lower posted prices all have impact on competitors. 

While any marginal dollar is valuable for smaller firms, the profit for firms will fall if the costs of marketing does not decline but the market price for management services is lowered. None of this should be news or surprising, but the economics of scale and pricing is becoming more relevant as returns from hedge funds move lower and the dispersion of returns compress. As the hedge fund industry moves from high new growth to taking market share from other firms, pricing as a tool for firm growth will become more sensitive to the impact of others. This is good news for investors, but bad news for the upstart firm who may thing that a good investment idea and hard work by itself will lead to success.