Saturday, January 31, 2015

Treasury note volatility VXTYN - there is a lot going on

The CBOE has been trying to develop a Treasury note volatility index to complement the VIX index. This contract market could be a good addition to the mix of exchange traded products although the chance of success is relatively low. Most futures contracts fail even if there is a good economic rational for its existence.There is no volume trading on the futures but that does not mean that the index is not useful for research. 

There are two indices that use the same methodology in two different asset classes which we can use to tell us something about relative risk. The chart above from the CBOE covers the financial and post-crisis period. Most investors would be surprised by the size of the extreme moves in bonds relative to stocks. Treasuries are risky. Bonds are not always a safe asset. The volatility could be over than stocks but the change in volatility is very large. The swings in risk and uncertainty are large and when  bond volatility moves, stock volatility may not see the same type of changes.


The first chart above shows the VXTYN index over the last year. It has been a clear uptrend with an increase of 26% for the year. There were three large spikes in the last four months starting in October 2014 with the bond flash crash. This is not the same volatility as a year ago. The end of QE has ushered in a new bond vol regime. 

The second chart compares the VXTYN bond vol index with the VIX stock vol index. Both are on the rise and both had spikes at the same time. There seems to be a common factor which has driven volatility across asset classes. Sell one asset class and you may be buying another risky asset. 

The relative differences in volatility and their changes provide a good foundation for thinking about the stock bond mix for any asset allocation.

Friday, January 30, 2015

Big endowments differ from their smaller counterparts


The big guys embrace diversification through alternative investments. This is the story of endowment asset allocations for 2014 and it seems like this will continue this year. Equity exposure at large university endowments is only 31% versus smaller funds which have 40-55+%. Everyone seems defensive versus the classic 60/40 equity/bond split, but the larger funds do it in a different way. They will have 1/3 the fixed income and 1/3 the equity, but over 2 times the alternative strategies. 

It seems as though this is a discrepancy that should not exist. Hedge funds are more accessible, cheaper and in forms that can be broken into smaller pieces, so it seems as though this issue is worth exploring. With the potential for rates being biased upward over the next few years and with the current equity rally gaining age, an assessment of hedge fund alternative seems appropriate for smaller endowments. 

Is the lower allocations associated with the cost of monitoring and due diligence or an issue of education? Brokers and wealth advisors who serve smaller endowments need better education, fund of funds are expensive and the cost of due diligence is not negligible. The current mix has to change but that has to be in the context of cost and effort. Perhaps the outsourced CIO concept will be the solution, but smaller funds are at risk in the current environment.

DB AWM- hedge fund portfolio weights


Deutsche Bank's asset wealth management (AWM) group has provided their model portfolio for 2015. It generates an interesting look into one group's view of where hedge fund performance will be going. From these weights, there is implied view of the markets. You may not agree with their portfolio logic but it gives a baseline for discussion.

Equity long/short and equity market neutral strategies are net long relative to their equilibrium allocations. This tells me that the AWM group believes equity markets are not going to be great performers, but you want to have a good exposure to this core strategy. Discretionary macro is showing a positive excess allocation yet managed futures (CTA's) is neutral with just a slight upward bias. This is odd given the strong relative performance of CTA's versus their discretionary counterparts over the last year. Allocators still seem to have issues with following trends even when performance is good. There is still a bias toward the discretionary managers.  The big loser is distressed which gets a zero allocation. Credit and event driven are both slightly lower than the equilibrium level.

Avoid credit, distressed, and event strategies and hold more market neutral and discretionary macro styles. This sounds like a defensive strategy which will assumes slower growth, full pricing of credit, and the chance of a lower returns relative to equity and bond benchmarks over the last three years. If there is macro risk, it seems like there should be more managed futures in the portfolio. You want low  or negative correlation to equities given their implied view. 

Sunday, January 25, 2015

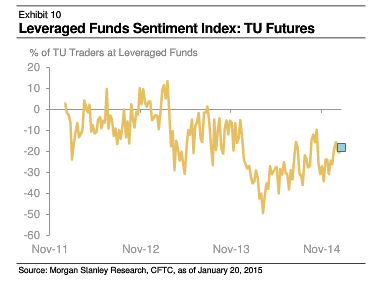
Following the crowd with COT traders

There is always a great desire to look at new measures of market sentiment. The CFTC commitment of traders (COT) has been mined significantly for years to find out what is the sentiment of hedgers, speculators, and small traders. Can the COT forecast price moves? The evidence is mixed,  but it does provide reinforcing information of current market tops and bottoms. It may confirm what is happening with prices. 

There is a new look at this data using the net long and short number of levered traders in the market. Follow the crowd and not the weight of positions. I have mixed feelings on the usefulness of this measure. It does not account for the number of dollar voters, just the number of voters.  Still, this measure seems like it is worth further investigation. When the crowd is moving, it is worth taking a look at where they are going.


Newedge trend index on the rise


You don't have to be an expert in trend-following to see it is worth taking a closer look at the Newedge Trend Index. It has exploded on the upside while other hedge fund styles have moved sideways. 

Newedge has looked closely at this issue and suggests that the upswing is related to the higher signal to noise ratios for many markets. Newedge looks at the absolute value of price changes divided by the average true range for specific holding periods as signal to noise measure. These numbers have been going up which is a good sign that there have been large absolute price changes without high volatility. Higher ratios make for an environment that is easier to find trends.


The 2014 returns show that trend-followers have found the market trend signals and have taken profitable positions. The signal to noise will change over time and the current low volatility may not continue, but there usually is persistence in this ratio. The performance trend is real and may not go away if current market conditions continue.

Bullard's distance function

St Louis Fed president Bullard has been talking about coming off the zero interest level by focusing on the distance function from policy goals. This is an old concept first discussed in the '70's but it still has a lot of merit. You can raise or lower rates based on the distance from the goal. This is the square root of the sum of the squared difference between current levels and goals. It makes monetary policy an engineering or control problem.


Morgan Stanley does a nice job of illustrating the Bullard objective function versus the Fed fund target. If the distance function is high, cut rates and if the function is low, raise rates. We have closed the unemployment gap and the inflation gap is relatively low. This is not prospective of what the Fed will do but certainly provides a simple measure of why a rate rise should be taken.


Saturday, January 24, 2015

Enhanced QE - The ECB's active balance sheet


If you try to easily explain the actual workings of the ECB QE program (actually the APP Asset Purchase Program), you understand why there is a 500 page manual for implementation.  A 60 billion EUR monthly program that if it last until at least September 2016 will increase the balance sheet of the ECB by 50%. The program will be 250% of the annual net issuance of all countries in the euro system. By comparison, QE3 was only 85% of net new issuance.

Of course, the scope and idea of a ECB balance sheet is complex since the sovereign bonds will be purchased by each country's central bank. These central banks will take the losses if there is a decline and eventually there will be losses. The size will matter. The program will include sovereigns, agencies, corporates and ABS.  It will change credit markets much more than the US QE programs.

There is quantitative easing but there is also enhanced quantitative easing based on the asset that are purchased by the central bank. If there is market segmentation or a portfolio balance effects, there will be different market responses based on the assets purchased. The action by the ECB is expected to have a portfolio balance effect especially with the purchase of sovereign debt. The relative purchase of debt for a particular country will impact credit spreads and effect fiscal discipline. 

With the size and scope of this program, there will be spill-over into all global bond markets. The monetary bazooka has been taken out and is being used. Asset price inflation will be on the rise in Europe. The trend from the beginning of the year will not change with this action.


Nickels in front of steamrollers? Perhaps not


One the adages coined about fixed-income arbitrage is that it is like "picking up nickels in front of steamrollers." I love the visuals associated with this phrase, but disagree with the premise. This may seem odd coming from someone who has been associated with divergent trading, but I appreciate the unique portfolio features derived from arbitrage or fair value strategies in the fixed-income markets. The evidence also suggest that fixed income arbitrage may have negative skew but also generates positive alpha. The real risk issue may be the exuberance of using leverage to pick up too many nickels and not looking for steamrollers.

Arbitrage trading is essentially a convergent trading strategy and should be uncorrelated with the trend-following found in most CTA's and classified as divergent trading. Fixed income arbitrage can be classified as non-directional or at least the majority of returns is driven by alpha not related mainly from rate moves. Consequently, quasi-arbitrage strategies have important diversification properties for any hedge fund portfolio as especially for those that are looking for market dislocations.

Focusing on fixed-income trading, we can identify a number of fair value strategies that have different distribution and portfolio characteristics. This is review in a Bank of Canada paper. These include: swap spread, yield curve, mortgage, volatility, and capital structure arbitrage. This work suggests that there is significant alpha capture with these strategies after accounting for stock and bond moves. However,  they also find that the more complex or sophisticated arbitrage strategies produce more alpha than simple strategies. Skill matters. Holding these unique skill driven strategies in a portfolio is beneficial especially if the alternatives in the portfolio are directional strategies.

Our view is that arbitrage strategies become dangerous when they are over-levered and do not account for distribution properties like negative skew. Skill matters, but the key to fixed income is understanding whether the trade is liquidity or event driven. If the premium from trading is based on liquidity, there is the threat that liquidity will not be available when needed. If the threat is event driven, there is the risk that a surprise event will drive price further away from fair value. Over leverage  increases the liquidity exposure and event exposure. If there is a high level of risk to liquidity and event risk, then other strategies have to be held that improve with changes in event risk. Versus the fixed income market, this means holding something that does well when there is more global macro dislocations.


The ultimate risk - covariance to bad times


The ultimate risk for any asset is based on the simple fact on whether it goes down in bad times. This is the most important risk that any investor faces. Investors want to be assured that their portfolio can maintain or improve their consumption pattern in bad times. What is the purpose of wealth if it not to hold onto our consumption patterns? Hence, any investor want to have some assets that will smooth their growth in wealth.

Investors always hold a wealth portfolio that will move up or down. This is the definition of   portfolio volatility, but the real portfolio risk is that your wealth will decline in bad times when your income may be negatively affected by a poor economy. Income changes with growth  which will then impact consumption. Investors want to call upon their wealth to smooth income and thus allow for smooth consumption. Call upon your wealth reserves so you don't have to change your consumption behavior.

A wealth shortfall when income is declining will impact your consumption pattern. A very valuable asset is one that will do better in bad times, or at least not as poorly. Investors should be willing to pay a premium for those types of assets. Their expected return may be lower than other assets. For those assets that are highly correlated with the business cycle, investors should receive a higher return or risk premium. 

The value of low correlation is very strong with portfolio diversification, but the static bundling of assets does not tell us the true risks and benefits of covariance with bad times. So what assets will do well in a market decline. We know that bonds may be a safe asset. Rates go down when their is a recession. We know that defensive stocks and non-cyclicals will also do better in bad times. A strategy that can go long and short and exploit market dislocations will also be valued. Hence, managed futures will have the right covariance to bad times.

One of the key reason for the benefit of managed futures is this specific property of negative covariance when times are bad. Some have called this crisis alpha. The benefit is actually very simple. A diverse portfolio with asset classes including equities, bonds, commodities and foreign exchange with the  ability to go long or short will have an advantage over a focused long-only asset. The focus of following the trend may do better than a strategy based on forecasts that may prove wrong. If you want true diversification look for the asset that may thrive in bad times.


Wednesday, January 21, 2015

Type I and Type II errors and investment decisions


Type I and Type II errors from any model is a fact of life but we need to place this in a broader context related to investor behavior. An investors who makes more Type I errors with their decisions is gullible while the investor who makes Type II decision errors is a skeptic. What type of investor are you? It should not be hard to look back over the trades accepted and rejected to see if you are gullible or a skeptic.

Let's go back to our statistics 101 class. A type I error is when we accept a hypothesis that is false, a classic false. What we perceive is in reality untrue. A Type II error occurs when we reject a hypothesis that turns out to be true, a classic false negative. What we perceive to be false is actually true.

 Of course, we are simplifying, but you can think about any investors who may make some mistakes in there thinking as falling into either one of these error camps. If you accept wisdom that proves to be false you are gullible. You act on everything you hear only to find out that it is false. You are just more accepting of thinking that proves to be false. On the other hand, if you are constantly rejecting different market conjectures that may prove to be true, you are a being a skeptic. Everyone is wrong and the markets are always efficient so there are no opportunities.


Being a skeptics has its advantages but when cash rates are low the cost if sitting is high. Being gullible increases transaction costs and portfolio volatility. Of course, if this was the statistical world we would increase the power of the test through increase the sample size to lower sample error. You cannot do this with unique decisions. Would you rather take action and then prove to be wrong or would you rather reject advice only to find out it proved to be true? 


Tuesday, January 20, 2015

How much do we need to know about Chinese real estate?


Real estate truly drives Chinese economic growth with 20% of GDP associated with that part of the economy. These numbers should be tracked by any global macro investor. This high percentage of GDP makes perfect sense given the huge movements in population from rural to urban centers and the corresponding increase in wealth both created and moved into real estate and housing. Nowhere is the combination of demographics and population movement so important to economic growth, yet the critical importance of housing is still not fully registered by investors. There has been the consistent talk about a real estate bubble and ghost cities, but real estate still is a key driver in wealth creation and consumer spending. Unfortunately, much of the negative talk is starting to be realized, albeit slowly, in prices.

Housing prices have turned negative in the Fall and real estate investment has fallen by over 50% and is now significantly lower than infrastructure investment. Residential floor plans declined 26.8% and property values declined 1.9%, the first outright decline since December 1999. Like any levered economy we have to look at the distribution of wealth and how consumption will be affected by changes in wealth. The link between wealth effects and spending is not clear, but a real estate slowdown may tighten spending behavior especially on higher-end consumption. There has been a clear switch from real estate to the stock market for speculative behavior. In spite of loosening monetary policy, the money flows seem to be moving towards stocks and not real estate

Fourth quarter GDP came close to expectations at 7.3%. This is good but at the low end of growth over the last few years. Monetary policy is driven to control the path of real estate.The impact of the US housing sector stirs market reaction more than China and this is a mistake. This negative real estate trend will create more headwinds in 2015 for both China and the rest of the world.

Monday, January 19, 2015

I want non-linear hedge fund returns!

There are two things you want more than anything from hedge funds, diversification, and non-linear returns. These are closely tied together, but I would suggest that the key unique feature is non-linear returns. Making it sound simple, we want positive returns when traditional markets are going up and positive returns when they are going down. This is positive up market beta and negative down market beta.

This profile should be the standard of success for hedge funds if you want to add something different to your portfolio return mix. Non-linear returns is the essence of good diversification. The non-linear returns will drive correlation closer to zero when you combine up and down market periods.

So what strategies will have the quality of non-linearity? This is not actually easy to test given the the wide variety of strategies and asset classes employed. It is not like all managers try to generate option like returns against the stock market. There has been work that provides some good idea of what strategies may be special by looking at optionality across different asset classes. They test for the optionality of a fund relative to key beta exposures.

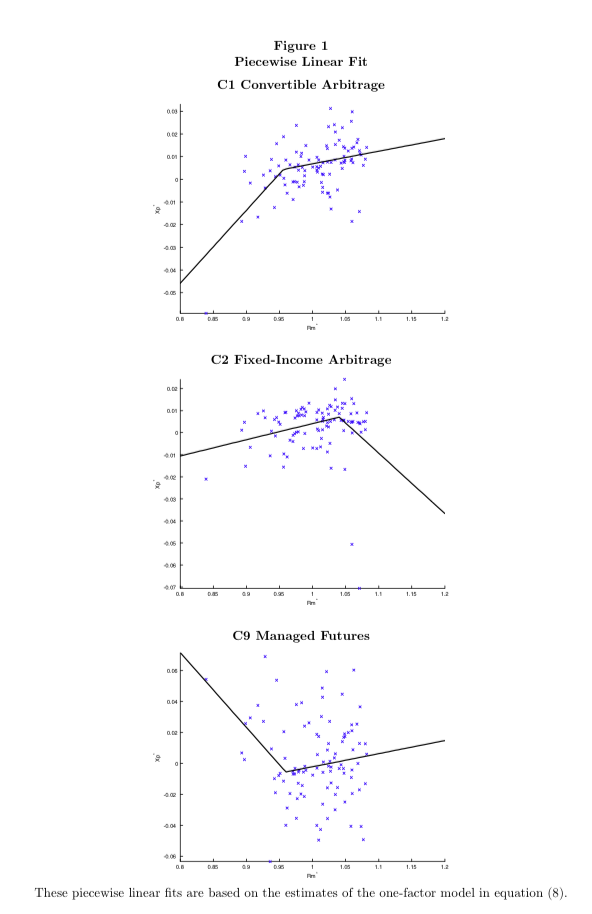
The figure below is from the paper, "Assessing and Valuing the Non-linear Structure of Hedge Fund Returns" by Antonio Diez de los Rios and Rene Garcia. It is a little dated but still provided some important insights. It shows three strategies which have non-linear return pay-offs. Investors should love managed futures if they want to make money in the extremes. As expressed by other researchers, the pay-off looks like a straddle.  

If you are worried about the stand-alone returns of managed futures, the addition of fixed income arbitrage is almost the perfect match. Convertible bonds are also a good strategy mix. The alpha for each strategy is different.  Fixed income arbitrage behaves like a selling a straddle. The authors are able to also show that not all funds within a strategy will have these characteristics.

Managed futures provide optionality against asset classes but may not generate a traditional alpha.  The optionality value should be fine if you understand why you are holding managed futures. The diversification value driver is the non-linearity and not the alpha generation.


The research suggests that there is significant differences within a category. All managed futures funds are not alike. Some provide non-linear returns and other do not, so due diligence needs to occur to find out if the pay-off desired is secured with a given fund manager. The broad generalizations, however, point investors in the right direction for better diversification.

Inflation is a global problem


The inflation talk has been very euro-centric but inflation is a global problem. This has been noticed by many  economists; however, it has not been the core focus of  policy-makers who seem to have more parochial interests. Solving the inflation for one country may not solve the global inflation problem.

Close to 30 high-income countries now have inflation below 1% and one third of those have negative inflation. The numbers are also high in developing countries which usually always have base inflation that is higher than the developed world. The range may be higher, but the trend is the same. The chart is from the World Bank Global Economic Prospects, January 2015.

So far, the solution is to flood economies with money and drive rates to zero. This has been good for asset markets, yet it has not been able to raise inflation rates. Unconventional policies should now not about buying more bonds. Asset inflation will still be the policy result of the day.

Trade has been a drag on growth

One of the key reasons for slower world growth has been the slowdown in trade. The growth trade has changed significantly with the post-crisi period well off the pre-crisis trend. This is closely related to the slowdown in commodity markets. Metals and food have all slowed, but goods and services have also declined. The chart is from CPB Netherlands - World Trade Monitor and  the World Bank.

If the world wants stronger global growth, it always has to go back to the issue of trade. Cutting currencies through monetary policy but not promoting trade will not lift the growth tide around the world. If the trade trend increases, the trend in global stock markets will also turn up.

Sunday, January 18, 2015

Global risks from an insurance perspective


One of the few ways to prepare for black swan events or shocks is to think about what could be the potential big threats. Develop and think through scenarios. Turn the unknown into know risks with some probability, albeit small.  The process of thinking about the unthinkable is critical in protecting any investment portfolio. Risks have to be identified, their likelihood assessed, and their impact measured. Of course, the actual events that may harm a portfolio are likely to be surprises but the process of thinking of alternative scenarios is the foundation of good risk management.

The 10th  Global Risk Report for the World Economic Forum provides a detailed analysis of current risks in a unique format that shows the interconnectedness of risks from some of the leading risk thinkers. These risks are global because there are likely to spill-over across all markets around the world. Insurance providers are likely to better think through potential scenarios because these assessments are part of  their core business. Money managers will often have too short a focus.  For global macro traders, these risks offer great opportunities to add value.

The key global risks can be classified as economic, environmental, geopolitical, and technology. These threats are often interconnected which makes for significant systemic risks. A geopolitical event can have economic spill-overs, may be expressed through technology, and may be set-off by an environmental shock.

Review of potential risk scenarios allow for just-in-case hedging or asset allocations decisions which are more important than trying to react after the event occurs. Still, it is hard to protect against all of these events so the first line of defense is diversification across asset classes and strategies.

Saturday, January 17, 2015

Happiness and systematic trading


Happiness and systematic trading. You may think I actually mean happiness is systematic trading, but that is not always the right answer. What I refer to is the idea that concepts of happiness actually effect how we build models and how we evaluate managers. Economists have often used concepts of utility to refer to our happiness, but recently there has been a greater push to explain what makes us happy gives us feelings of happiness and how our decisions effect our level of  happiness.

Researchers have found that one of the key characteristics of happiness is that intensity is more important than duration. An intense pleasure experience will have a more lasting impact than a long period of bliss. Similarly, an intensely negative experience will have a greater impact on our overall well-being than low level negative feelings. Additionally, our happiness about an event changes through time. Our feelings about a financial crisis during the event will be different than how we feel years later. Also our expectation of happiness is higher before an event than after it occurs.

So how can we make the right decision for structuring a portfolio if our feeling of happiness about the portfolio changes? For starters, we need to understand the dynamics of happiness and how it may effect our portfolio construction. We cannot be fooled by our changing feelings of happiness.

As described by Daniel Kahneman, the heart of the happiness issue is that it seems we have two selves, the experience and memory self. The difference between these two affects how we think about happiness. There is the actual experience we feel and then there is the memory of those feelings. These do not always match. How we feel about an event, either good or bad will be different through time. Our immediate experience does not always match our memory which will fad through time. Our memory will record vivid events more than long-term feelings. We should not overreact to what think we will feel or what we feel at the time of the event.

Building models can eliminate the Kahneman problem of two selves or at least place them in check. The pleasure or pain we receive from investment success or failure will be static to a model. The experience and memory in a model will be the same. It breaks the problem of two selves by avoiding issues of experience and memory. The fact that there was a financial crisis in the past may not matter.

Because our experienced utility and affected forecasting (predicted utility) do not match, the expected happiness of a good return will not match what we actually feel. We wish for good returns but the level of happiness that we get for those returns will usually be more muted. Again, a model can eliminate these differences.

Now, models can have a difference in experience and memory if we throw out information. If we drop data of a bad experienced return, we are in essence dropping it from our model memory. If we weight data equally, any strong experience will have less impact on our model memory. Longer averages will smooth out feeling of happiness surrounding any one event. In that sense, the "feelings" of model will be affected over time.

While you may think that happiness will just come from steady returns, our reaction to events will have a strong impact on our future behavior. Those unpleasant investments as well as those that gave us pleasure will shape portfolio construction. Feelings should not be dismissed, but should be controlled. 

Friday, January 16, 2015

Swiss franc and the center cannot hold


   Things fall apart; the centre cannot hold;
  Mere anarchy is loosed upon the world,   

 The blood-dimmed tide is loosed, and everywhere   
 The ceremony of innocence is drowned;

- William Butler Yeats 


Central banks cannot control markets or events. They may try and their actions my slow the tide of capital flows, but eventually market forces erode central bank barriers. There is a long history of central bank intervention especially when trying to peg or target a rate. 

The market was surprised by the Swiss appreciation from the change in SNB policy, but history tells us that caps cannot last forever when the fundamentals dictate otherwise. It was surprising that the SNB was able to hold its cap for over three years. The size of the euro  liabilities was becoming unsustainable.

It is also surprising how cheap transparency and forward guidance is when it does not suit the objectives of the bank. Of course, sending any signals would have had a similar effect but how much creditability does the bank have now. Finally, it is interesting to hear the talk about systemic risk in the market when it was a central bank that created the risk in the first place. If the bank never capped the appreciation, the severe loses would never have occurred.

Now the investors and exporters will pay the price of government induced market distortions. The center cannot hold and market participants are left holding the bag.

Thursday, January 15, 2015

When macroeconomics relationships fail, simpler approaches may succeed

  • The Fed balance sheet has exploded, inflation is down and the deflation is a threat.
  • Unemployment is down, growth is up and inflation is down.
  • Budget deficits are down, austerity is up, and employment is up.
  • Growth is up and interest rates are down.
  • Growth is below trend but asset prices are significantly higher.
Perhaps an over-simplification or a set of straw men representing some false macroeconomic relationships but the failure of some key relationships gets at the heart of the problem for global macro investors. The simple relationships or rules of thumb of what should occur in the macro-economy are just not working. 

Most of the big macro trades are based on simple stories and those stories have proved to be false. For example, think about the big Great Rotation story that was all the rage a year ago. Long bonds performed well even though employment and growth were up. Looking at macroeconomic relationships has always been about subtlety, but this has especially been the case in the post-crisis period. Telling stories based on a simple relationship learned in some long ago economics class is dangerous.

There are alternatives to using these relationships which have not held up to closer review. The simple answer is to uses price-based systems to serve as the primary guide to decision-making. A price-based system would have held long bond positions for a good portion of the year. Decision rules based on  price would have cut exposure at some key times during the year but would have still held equities in key global markets. Following prices would have reduced or eliminated long oil exposure regardless of the musing of expert oil analysts. 

Price-based systems use the weighted average views of all market participants as measured by their dollar votes. It will not always be right but in an uncertain world it may be superior to placing bets on relationships which are in a state of flux.


Sunday, January 11, 2015

Managed futures as an anti-fragile strategy

Nassim Taleb - fragility is aversion to disorder, Things that are fragile  do not like variability, volatility, stress, random events which cause them to either gain little or suffer.

Nassim Taleb has been focused on the difference between fragile and anti-fragile systems for a number of years. It is a great way to think about many problems form those in finance to political issues. The application of this concept is significant beyond any one field of study. Recently, Nassim has written about this concept in the political realm for Foreign Affairs in "The Calm before the Storm." This is just a further extension of his book Anti-fragile which we have written about in the past.

The concept of fragile and anti-fragile strategies is very useful for explaining difference is hedge fund strategies. An investor should try to have some ant-fragile systems as a form of diversification.  Since an anti-fragile system may not be the best performer when markets a calm, investors have to accept and expect a different return profile for these strategies. Markets are generally calm because policies, politics, and the business cycle are calm. Markets behave according to conventional wisdom as expressed through past correlations. However, this does mean placing all of your money in fragile systems based the status quo of market behavior. The chance of extreme events are real and strategies that can at least survive and possibly thrive during market dislocations are well worth investigating.

Managed futures is an anti-fragile strategy. However, the value in managed futures is not just based on its performance in absolute return or relative to traditional assets. Forget about just looking for low correlation, The focus should be placed on its crisis alpha, or diversification in behavior when there is an unexpected event or dislocation. Managed futures (trend-following) is an anti-fragile system because it tries to profit when markets have divergences or are in a state of disequilibrium. 

The focus on strategy diversification should be much broader and deeper than looking at the numbers. Investors want to have some strategies that do well when the world is no longer calm. When there is disorder and the unusual, or when there are market divergences and disequilibrium, investors want something in their portfolio which will actually do better. This is the foundation for divergent trading strategies.

Strategies that like order will be confused when there is more uncertainty or a movement to the extremes. Fragile strategies will be run by the managers who say, "I don't understand why cheap stocks are getting cheaper!" or "The markets should not be acting this way." They are the ones who search for rational behavior that can be easily explained, yet market may move to states which are not easily explainable. Albeit moving to these extremes is often rare, but the risk at these times is extremely high. Preparation for these extremes is not about hedging or insurance but rather a state of mind on how to act when there is high uncertainty.  

The anti-fragile system does not have a requirement for the market to make sense. It looks forward to uncertainty as a period of opportunity and strength. It is not that disorder is chosen. Rather disorder is something that provides opportunity. At these times the best strategy is being disciplined and following market prices even if it is at odds with conventional wisdom from models that are not working. Investment surviving is best done through being able to accept and exploit uncertainty.

(See my post, Lakewood-Views: Describing disorderLakewood-Views: Quotes from Nassim Taleb's Anti-fragileLakewood-Views: Anti-fragile will change your thinking. )


Survey disagreement is not the same as uncertainty


Often analysts will associate differences of opinion with market uncertainty. I have made this shorthand mistake even when I know better. Saying there is a dispersion of opinions is not the same as saying that market views are uncertain. Forecast uncertainty is the measure of dispersion surrounding the mean opinion of any forecaster.

Opinions can be very different but at the same time very confident and certain. We often refer to consensus as a lack of differences in opinion of survey participants but that does not tell us anything about the uncertainty of those opinions.  See Zarnowitz. What research has found is that the standard deviation of point estimates may underestimate the true uncertainty with some forecast. 

Recent research by the NY Fed pushes this issue even further. It finds that there is not a strong link between the uncertainty and disagreement in forecasts as measured by inflation forecasts. We have seen EU inflation disagreement go down but uncertainty go up since 2010. There was an opposite effect in 2003-2007. Data in surveys are complex and nuanced and requires deeper analysis than we often employ. 


So what doe this mean for the macro investors? Uncertainty is more subtle than just looking for dispersion of opinions. When there there is more uncertainty, less emphasis on survey consensus make sense. Yet, we may not have the tools to measure this uncertainty since there are limited surveys. 

Market data, on the other hand, may give us a better view on market uncertainty. It could be something like the VIXX index or opinions based on option prices, but market votes through actually buying and selling in markets may provide an effective guide for market uncertainty. The crowd information in market prices especially at extremes is useful. 

Monday, January 5, 2015

Pension fund liabilities and the need for uncorrelated assets


Pension management is not about volatility, but risk to the funding level. A pension that is underfunded is facing a significant liability risk that will have to to be financed in some form. A pension with 100% funding rate does not have to add any money to the pension and has the option of closing while still meeting its funding obligations. The plan choice does not have to be made, but it is a clear option and presents no funding liability. Clearly a firm that is at 100% funding can eliminate this liability and focus on its core competencies. 

After a period of excess funding in 2000 and again in 2007, pension are below 100%, but the gap is closing. The question is whether they learn how to deal with this funding risk appropriately. Greater stock allocations was the solution for getting out of the underfunding since the financial crisis; however, those are the risks that could put pensions back in the same problem.

The problem is actually much worst than just funding shortfall. There is a big difference between the portfolio composition for endowments and corporate defined benefit plans. The corporate pensions have taken their risk through greater stock and bond allocations. Endowments have taken more of their risk through hedge funds. Given the higher traditional asset weights, there is little room for error with corporate endowments. The corporate pension funds for Russell 300 companies feel they can generate more return than endowments. Corporate pension fund median return expectations are 9-9.5% while endowments are expecting 7.5-8%. Given the current low rate for fixed income, these assumptions still expect high equity returns. For corporate pensions, the math suggests that double digit equity returns are required to meet expectations.


These pensions risks requires some strategies that will generate relatively high rates of return with low correlation. More importantly, if there is high beta exposure, there needs to be some assets that will perform well in down markets as protection against funding risk. The list of high performing diversifying assets is relatively small after you account for the low carry in fixed income.

Managed futures may be one of the view alternatives that fill this void. The negative correlation in down markets, the high annual return, and the inherent diversification are all reasons to hold some exposure to managed futures when the hurdle funding rate is high. Managed futures may have fallen out of favor over the last few years given an expected pension rate of return of 9%, but the strong performance in 2014 and the continued diversification benefit may require pensions to take a second look.

Saturday, January 3, 2015

Forward guidance and the PBOC


The People's Bank of China has been loosening monetary policy but you would not know it without a careful review of all the tools available to the central bank. The PBOC runs monetary policy through a set of strategies that has lowering interest rates as just one of the choice available. While most central banks employ raising and lowering rates as the primary tool for policy, the PBOC seems to choose unconventional tools first. The central bank may not have gotten the global memo on forward guidance as an important tool. Communication is just not that important for the PBOC. This is at odds with the behavior or standards of most other central banks.

In the last six months, we have seen significant increases in indirect lending facilities through the China Development Bank, lowering of the deposit ratios, re-loan rates, deposit, and lending rates. All these changes are attempting to boost growth without having to directly explain that Chinese growth needs boosting.

This lack of transparency will lead to more speculative behavior by investor and also the chance for major mistakes. The large stock market move is in part a direct response to this monetary stimulus. Growth is slowing but monetary stimulus is increasing so we are seeing asset price inflation.  Without guidance, many investors are thinking these increases in lending facilities will continue along with lower rates.

In fairness, even central banks who espouse forward guidance and transparency have not always done a good job; however, the risk of miscommunication is higher when communication is in short supply. 

Pump down the noise - Decision silence


The hardest part of decision-making is being able to separate information from noise. In a textbook investment problem, you are given useful information which you employ to form a probability distribution of possible returns. You take all of the information and find the expected value for an investment and make the decision. 

The real problem is when you have too little or too much information. The issue of too much information is one that has always vexed investors but is usually not handled in an investment class. (Case studies may be the exception, but classic finance classes do not address noisy information.) Nevertheless, there are simple solutions that have always been used to deal with this problem. We just may not speak about it in terms of noise.


A large part of the value associated with trend-following is on noise reduction and price smoothing. Think about the simple case of the moving average. For example, you take twenty days of information and average to compress into one number. This is a noise reduction technique. All of the ups and downs from highs and lows as well as the daily movement is filtered out through averaging. We cut the noise to find the true signal.


Most system research is trying to find the right trade-off between noise reduction and information efficiency. If you take too long of a moving average you are throwing out too much information. Employ a short-term moving average and you still have significant noise. 


Break-out or channel systems are another form of noise reduction. If you are inside the range, you may ignore the prices and throw out this noise. This approach provides a new twist on the concept of noise traders which have often been given a bad name.


Noise reduction changes the decision process and reduces the decision choices. This reduction process may calm decision-making for the better. Silence is good.

You don't have to make an investment decision


There is a major economic announcement, the market starts moving, and trading volume has increased. The talking heads are abuzz with their analysis. Under this situation, many investors believe that they have to make a decision or take some action. If everyone else is doing something, I must do something too. Follow the herd when the twig snaps. However, without a plan, this could be the worst possible action.

Perhaps one of the greatest qualities of employing a system is knowing when not to trade. A good trading system will likely have you sit and do nothing a lot of the time. Shocks to the market will generally not be significant. Success is based on waiting for those that are meaningful. The idea of any rules-based system is to limit trading to those times when there may be an edge or a true reaction is necessary. It will have you do nothing if there are no identified opportunities and it will have you sit and do nothing if you are in trade that is making money regardless of what new information may be coming into the market.

I like to idea that a system can tell me when to act. I may like it even better when it tells me not act even when I have the urge to do something. A system stops my emotions from getting the better of me. Patience is an investment virtue. Keep calm and do nothing until the odds are in your favor.

Thursday, January 1, 2015

Marks' "failure of imagination" and the new year


Howard Marks often talks about the "failure of imagination" as one of the key problems with investment management. Investors do not see the full set of possibilities no matter how improbable. Additionally, most investors do not think about second order effects of the some shock to the investment world. For example, investors did not see the decline in oil prices and certainly have not fully realized the secondary impact of the decline across markets. This will lack of imagination will continue to be played out in 2015.

This failure of imagination is being unable to conceive of all of the alternatives or possible outcomes.  What is not thought of cannot be handicapped. It cannot be put into the possible states of the world. The lack of imagination increases the likelihood of surprises. For many, the surprise event is only a surprise because it as not not though possible no matter how unlikely.

The failure to imagine means that we do not see or accept change when it occurs. Market failures are rare events, so we naturally are not going to imagine what the world will do differently in those situations.

The failure of imagination is also being unable to think across assets. If an event occurs in one market, will it spill over to the next market or asset class? You may imagine a decline in oil prices, but do you fully realize what this means for growth or inflation? Can you conceive what the impact will be on interest rates or credit markets? The quantitative analyst will focus on asset correlation, but this is a much simpler idea. You do not need the stats to think about the linkages across markets. In fact, assuming correlations stay the same may be the greatest lack of imagination.

Is it possible to gain investment imagination? It is not easy, but there could be some simple steps to help the process. The first and foremost understanding what the world is like at a given moment. If you do not know the current state, you cannot determine or imagine different states. Second, is engaging in the research of looking for change in relationships and understanding the history surrounding past market events. Your imagination is limited if you do not know the history of markets. The final and hardest part is conceiving what can change in the current environment. Of course, a simple way to increase imagination is to just not follow the consensus or think about what is an alternative to the consensus. The consensus at the beginning of 2014 was for higher oil prices. The simple imagination test is working through scenarios which could cause a lower oil price.  Imagine the opposite as a start. For example, good risk management is just imagining what you will do if something goes wrong.

 For 2015, let's increase our investment imagination.