Saturday, June 29, 2024

The Gambler's Fallacy and the law of small numbers


What is the count? This is a critical question because investors are often deceived by a belief in the "law of small numbers", the erroneous view that a small sample will be representative of a large sample.  If you have a small sample size, what you may expect is not close to reality. 

This view or belief in the law of small numbers often leads to the gambler's fallacy or alternatively, the "hot hand" bias. Each is somewhat different in that they adapt different conclusions, but they are both based on mistakes associated with small sample. This idea when applied to the gambler's fallacy leads to the false conclusion that streaks will even out to be closer to the representative sample. People who believe in the law of small numbers and think they know the distribution are insensitive to sample size and will assume that results will mean revert. In the case of the hot had, a person does not have an idea about the distribution and extrapolates from the small sample to a more general view.

The gambler's fallacy has also been called the Monte Carlo fallacy or the fallacy of the maturity of chances and states that if an event has occurred less frequently, it is more likely to happen again.  If someone flips five heads in a row, the fallacy will say that the probability of a tail is more likely. This thinking is wrong. Hence, there is a fallacy. The likelihood of heads or tails is still .5 regardless of the past. 

This insensitivity to the sample size will also lead to the clustering illusion where people will see streaks with random events and see non-random behavior. 

The hot hand suggests that a sports player like a basketball shooter can have a hot hand and thus should be given the ball when he has a successful sequence of baskets. Could basket players have streak shooting? Can baseball hitters have streaks? Yes, it is possible, but the more likely effect is a clustering and sampling bias. The evidence on hot hands is mixed with some statisticians finding the effect, yet given the mixed results, a conclusion that there is a bias is more likely.

Before you get too excited about some strategy or make judgments on what will happen next when faced with an event that has a small sample size, ask the question if you are engaging the flaw of small numbers.

Friday, June 28, 2024

CPI versus PCE indices - The confusion from differences


A comparison of inflation indices: the Consumer Price Index (CPI), which is produced by the Bureau of Labor Statistics (BLS); the Personal Consumption Expenditures (PCE) price index is prepared by the Bureau of Economic Analysis (BEA).


The PCE fell slightly this month, but it is hard to tell what this means for the CPI. There is correlation because both are driven by price changes, but the wiggles and differences in the short run are hard to forecast.


Differences in the indices:


1. Formula effects. The CPI and the PCE index are constructed from different index-number formulas. The CPI index is an average based on a Laspeyres formula, whereas the PCE index is based on a Fisher-Ideal formula.


2. Weight effects. The relative weights assigned to each of the CPI and PCE categories of items are based on different data sources. The relative weights used in the CPI are based primarily on the Consumer Expenditure Survey, a household survey conducted for the BLS by the Census Bureau. The relative weights used in the PCE index are derived from business surveys—for example, the Census Bureau’s annual and monthly retail trade surveys, the Service Annual Survey, and the Quarterly Services Survey.


3. Scope effects. The CPI measures the change in the out-of-pocket expenditures of all urban households and the PCE index measures the change in goods and services consumed by all households, and nonprofit institutions serving households. 


4. Other effects. A variety of remaining differences consisting of seasonal-adjustment differences, price differences, and residual differences must be taken into account for a complete understanding of the differences between the CPI and the PCE index. 


Thursday, June 27, 2024

Science Fictions - One of the best book for any scientist/analyst


Stuart Ritchie has written one of the best science books I have read in years with Science Fictions. It does not fall into the category of creative or path-breaking science, but in a single book it rips-off the facade that science and published research is always objective and does not make mistakes. Science is supposed to be about finding the truth without regard to the costs, yet Stuart meticulously shows how fraud, bias, negligence and hype run through-out current science. This may not represent most of science research but there is enough deviation from the truth to cause anyone to be more suspect and careful of what is being presented. 

Fraud does occur because the rewards from being a top scientist are significant. Hype also surrounds many scientific results. What is aid to the press may not be reality. Biases exist because many scientists want to see a particular result and there just are mistakes from poor editing and reviews. If this happens with peer-reviewed research, it certainly is likely to occur with investment research. For those who follow academic research, beware, good results are often too good to be true. 

Planning is everything - Especially for investing


 “Plans are worthless, but planning is everything.” 

"The reason it is so important to plan is to keep yourselves steeped in the character of the problem that you may one day be called upon to solve.”

-speech to the Army War College by Dwight Eisenhower 

Of course, we cannot forget the classic comment on planning from Mike Tyson, "Everyone has a plan until they get punch in the nose."  The point is clear. Plans can go wrong, but planning is always right. Work through all the scenarios. Deal with contingencies. Plan for possibilities. Many events may never occur, but learning to think about could be will prepare you for what will be. 

Wednesday, June 26, 2024

Sample size and power for any test should be considered

Reviewing some modeling tests has caused me to go back to looking at the power of a given test which is often overlooked by analysts. We want to minimize the the probability of committing a type I error which is a false positive, and we would like to maximize the power, minimize beta or a type II error, a false negative, failing to reject a null hypothesis that is false, an error of omission.

Starting out there are two types of errors: 
  • Type I error – we reject the null hypothesis Ho when the null is true; alpha = P(Type I error). This is the standard test we follow when we test for 95% confidence or 5% change we are wrong. We calculate the p-value and then determine whether it falls above or below a threshold.
  • Type II error – we fail to reject Ho when Ha is true; beta = P(Type II error). This will be the power of a test. 
  • Type I: "I falsely think the alternate hypothesis is true" (one false)
  • Type II: "I falsely think the alternate hypothesis is false" (two falses)

These two types of error are inversely related; the smaller the risk of a Type I error increases the likelihood of a type II error. Note that we cannot compute beta or the probability of a type II error unless we know how false the null actually is which makes finding the probabilility of a Type II error difficult. 


Calculating the the power of a test allows us to determine the sample size necessary to not make a type II error. Generally, you need a large sample for most tests to say there is a significant difference with any strong likelihood. We often don't have that luxury, so it is important to consider both type I and type II errors. 


Monday, June 24, 2024

Accuracy, complexity, robustness, variance, and bias in one chart


from Pedma @pedma7


One key advancement with machine learning and data science has been the increased focus on the trade-offs associated with model building and testing. There is a trade-off between accuracy and complexity as well as robustness. If we add more complexity, our robustness will be lower. There may be less bias but there is likely to be higher variance from overfitting. On the other hand, if we lower the complexity, there is more likelihood of higher bias.  We will likely be under-fitting. The impact between training and testing is clear. We can improve our training model through adding complexity which should  increase accuracy, but this will result in overfitting. However, when will use this model on a test sample our accuracy will likely decline.  The problem can become worse when we look shifted or modified sample.

The problem is present through finance if we are trying to make predictions. Models that work in training through academic papers fail out-of-sample. Trend models that add more features underperform simple models when put into production. The challenge with finance is not coming up with new models or features but learning how to better use the features that already exist.

VUCA - We live in a complex world which may lead to metacrisis


 from Art Berman @aeberman12

While rare events have low probability, the risk may be high given the strong impact on returns. This is especially case for systemic events that will affect many assets or impact many asset classes.  To think about large systemic risks, an investor should start with the key assumption that the world is complex system where a shock in one part of the system will spillover to other portions of the global economy. Crises occur because markets are connected, and they become more connected if there is a singular event that will change overall market expectations. An increase in global risk will impact all markets. A large shock can work through one market and then cause asset allocation adjustments to a portfolio.

Our greatest risks are not a single crisis in a specific market sector but a meta-crisis that crosses over to other parts of the global system. Our concern should be with meta-crises where a dislocation in, for example, geopolitics will impact the energy markets which will then affect supply chains, which will contribute to a global slowdown which will then impact society expectations which can then shock the environment. We have been lucky in that large geopolitical crises in Ukraine or the Middle East have not yet spilled over to other portions of the global system. 

The current global economy has shown significant resilience. Attacks on shipping in the Red Sea has disrupted traffic but it has not been felt yet in global trend numbers. Sanctions have been placed on Russian energy, yet trade routes have been quickly adjusted. Perhaps we are not giving the resilience of global economy enough respect, yet the threat to a meta-crisis is real. 


Thursday, June 20, 2024

I thought you said there will be a copper shortage? short versus long-term investing


The big commodity buzz has been about shortages especially for key metals that are associated with the EV car and renewable energy revolution. Many analysts have argued that the long-run move in copper is higher. There is a shortage of supply form under-investment, and a strong demand from a shift to energy renewals and infrastructure. The tide is pulling copper prices higher.

So, what have we seen now that the copper story is at fever pitch? There has been a significant decline based on a China slowdown in the last month. Prices are still higher from the beginning of the yea, but the cost of buying copper fever has been high.  Chinese copper stocks in the warehouse for delivery on the SFE are now at the highest levels since 2020. Copper in China is now selling at a discount. 

If you want to be a copper trader, don't worry about the long-term, just follow the trends. This is the difference between investing and speculation, the former is long-term and the latter is short-term.  One is not better than the other, but each has a different timeframe and return objective. 

We can be headed into a new super-cycle, but that does not mean that the trend will always be pointed upwards. 


Commodities and the business cycle


The commodity cycle is not the same as the business cycle which is not the same as the credit cycle. Get these three right and you will be ahead of the competition. The problem, of course, is that there is too much time spent on forecasting the future and not enough time spent on determining where we are in the current cycle. You cannot talk about where you are going unless you know where you are.

It feels like this is or should be late stage in business cycle, but it is less clear where we are in the credit cycle. We are, by all accounts in the tightening phase, but the real economy and credit spreads do not reflect that in the data. 

Associated with the business cycle is the output gap. If we are late stage, then output should be above capacity and the gap should be falling, yet the world seems to have significant excess capacity. Following the simple chart, we might still argue that there is expansion.


Nevertheless, if we focus on specific capacity for industries, the story is different. Total capacity is not at extremes, but if we focus on commodity specific capacity, the story is different.  For mining and oil, we are at capacity. Fabrication may have excess capacity, but the raw production may be constrained which will lead to a drawdown on inventories; however, the capacity measure we may have a commodity issue.

This is a complex process, which is one of the reasons so many traders will just say show me the trend. 

How long is long enough with a inverted yield curve signal


I have been disappointed by the inverted yield. I truly like the simplicity of yield curve inversion as a key recession indicator. It makes perfect sense that an inversion increases the cost of short-term money and is a good reflection of tight monetary policy. Given the lag of around, at most, nine months for a monetary shock to impact the real economy, we should have seen the slowdown anticipated, yet nothing points to a recession, and we are now beyond 400 days.

Do a throw-out this recession indicator? No. First, I must understand why it does not work. What am I missing? A good signal has a strong link between signal and market response. A highly variable response timing is an ineffective signal. Second, I must recalibrate thinking so this signal loses power for any allocation decision. Markets change. Signals fail. New work is necessary. 

ADS business conditions index from Philly Fed looks strong


The ADS is a high frequency business conditions index based on updating of macro data as it is generated. It includes: weekly initial jobless claims, monthly payroll employment, monthly industrial product, month real personnel income less transfer payments, monthly real manufacturing and trade sales, and quarterly real GDP. These data have a blend of frequencies  and is updated as the new macro data are produced, so it is a nowcast of business conditions. Watching this series closely for years, it shows limited amplitude except at extremes; nevertheless, when the index is above zero and growing, the economy is growing. The average value is centered at zero. 

The beginning of the year showed strong indication of a slowdown, but the index has seen a sizable uptrend into positive territory. The current reading shows a top, but it may be early to suggest a growth decline.

The developed world is shrinking! Cannot trade on this but it is key investment theme


Demographics has been viewed as destiny, yet you would not want to use it as a trading signal in the short run. Following population trends would have not worked because it would have put too much emphasis on EM equities over the last decade; nevertheless, these demographic trends should not be ignored, and they produce some key pressures on all markets. Demographics, however, are not just about investing in the growing problem. It is also about investing in developed market companies that service these growing population regions.  They are many ways to play this theme.

Wednesday, June 19, 2024

Living in a VUCA forecast world - Conflicting recession signals


This is a very interesting chart of two market-based recession models. The NY Fed probability of recession model is based on the inversion of the yield curve. Inverted yield curves have generally been a good recession indicator for most of the post-WWII period. It currently has been in the longest period of inversion without a recession. This market-based model seems to be failing and providing a false signal; however, right now it is indicating a greater than 50% chance of recession.  Oh well, it may eventually be right. 

The Fed excess bond premium recession indicator focused on the credit spreads in the bond market and suggests that there is a low probability of recession. Credit spreads have tightened over the last year. No recession expectations in the credit markets.

Which one should you believe? There is a clear signal if both are moving in the same direction. There is no signal if they are moving in the opposite direction. What next?

Lever now and risk manage later - No humor in that


A good comic always has a ring of truth. There is humor in pointing out the truth to those who may not see it. The phrasing could easily have been changed to lever now and manage risk later.  Of course, this is not the behavior of everyone, but often the approach to asset management is take on the risk and then have risk management kick-in if something goes bad. Make the trade and then think about risk. Buy now and panic if your thesis is wrong.

A stop-loss is an after-the-fact risk management approach. Position now, manage risk later. There may not be anything wrong with this approach. A stop-loss is accepting that something unexpected can happen. However, an exit plan is not the same as some measurement of what may change to convince yourself that the original trade idea is wrong. If these conditions change, I will change is a better dynamic than just a stop-loss. 

Tuesday, June 18, 2024

Looking beyond the Magnificent 6 or 7


If you are looking for breadth in equities, you will not find it. A majority of stocks in the S&P 500 are underperforming the index. You will have to go back to 1998-1999 to get similar results. The Russell 2000 is at the same level as it was in early 2021, and the Russell 2000 and SPX equal-weighted index are both underperforming the mega-cap stocks. There is a limited wealth effect for the those who own the broad market. 

This is not a bear market, but all the arguments that the cost of capital has increased and thus making the present value of earnings lower holds true. There may not be a credit constraint for tech, but there are constraints for smaller cap stocks. There may not be a constraint on pricing for mega-caps but there is one for smaller caps. Earnings seem to be holding well, but the future expectations may not consider the current behavior a trend. 


Monday, June 17, 2024

Sensitivity to macro announcement surprises not always the same


Asset prices will respond to economic surprises. This is expected. When new unanticipated information enters the market, prices will adjust; however, the sensitivity to these surprises is not consistent. For example, 10-year yields are more sensitive to surprises now than for almost any time over the last two decades as measured through a regression against the Citibank surprise index.

Given the uncertainty about inflation and growth and the current Fed policy of being data-driven, any change in major economic data will generate a greater yield reaction.  This sensitivity will continue until we get new clarity on the direction of rates from the Fed. The sensitivity will then return to its longer-term average. Surprises must be conditioned on the macro environment. 

Friday, June 14, 2024

No recession but where is the optimism?


The US economy is not in recession, yet there is little optimism from small businesses. This is a puzzle. The economy is doing well, yet NFIB optimism index is at levels that we have seen just after the GFC. The trend is the worst since the GFC. We don't have a good explanation. Wealth is being created, but it is not being felt with small businesses. Earnings for corporations have been attractive but again that is not being felt by small businesses. We know that equity returns are concentrated with the magnificent six centered on tech and AI, but that does not explain the poor optimism. So, what are the concrete causes? 

Thursday, June 13, 2024

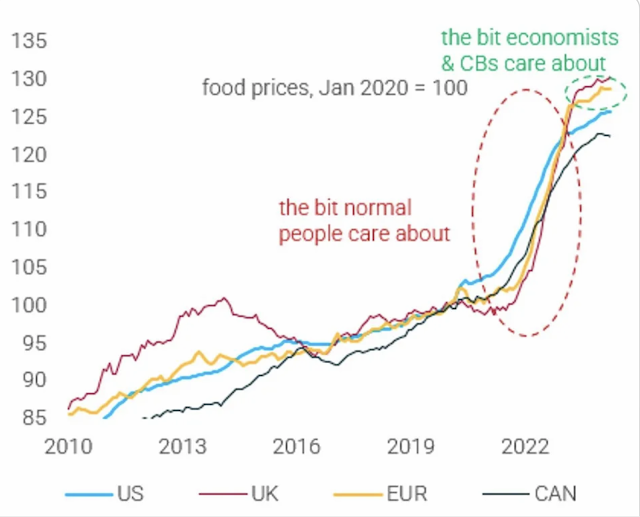
Why do consumers think differently about inflation from central bankers?


from Daily Chartbook 

"Normal people have a different way of looking at inflation compared to economists/central bankers."

- Dario Perkins, TS Lombard


This is a great way of thinking about how different groups view inflation differently. Central bankers are interested in the current rate of inflation. For them, the past is the past. Nothing to solve there. Consumers are worried about the level of prices. The past is important. Their concern is about whether prices will fall to old levels. Of course, wages may have increased, but consumers are smart enough to know that if real wages don't increase, it does not matter. Consumers also care about the inflation of repeat purchases. These prices stick in their minds.

Wednesday, June 12, 2024

Whistling in the graveyard of CMBS


Investors may be whistling past the graveyard of CMBS. Certainly, small and regional banks are walking in this graveyard. We are now well past the COVID pandemic economic destruction, but life has changed and fixed assets are still in the process of adjustment. Corporates do not need office space for employees that work from home and will not return to the central business district. Leasing will continue to roll-off, and available space will continue to grow. It is not a matter of price if you just do not need to good. Available rates for every major city are at or above 20%, delinquencies are at 7% and do not seem to be at a peak. Major firms are walking away from buildings and real estate transactions are showing massive discounts. Some is taking the loses and we cannot assume that the problem will fix itself. Rates are unlikely to fall this year by any amount that will positively impact real estate. The slow walk of a crisis is at hand. 

Tuesday, June 11, 2024

The herd and trend-following - we are at extremes


The herd will cause a trend. This statement goes without saying. Trends occur because there is an increasing number of traders who are willing to pay a higher price, yet we cannot see the herd we can only see their actions. We also know that the herd will get exhausted. again, we don't know when that happens because we cannot see the herd. However, we do know that at some point these trends will reach an extreme. There will be profit-taking whether it is advised or not. There will be an end to new buyers and existing buyers will have used their capital. 

We currently have a strong momentum rally; the herd is at an extreme. The weight of high momentum stocks is also at an extreme. Accept that there is trend exhaustion and there is a limit to the herd's ability to push prices higher; however, talk about the herd is often just talk. 


Fixed income response to announcements is strong


Economic surprises have a strong impact on fixed income and the yield curve. See "How do economic surprises impact the yield curve?". This paper looks at the announcement effect for a wide variety of macro data and shows the impact on the different duration instruments and the relative impact of different macro data. Like other asset classes, the employment announcements have the greatest impact. In all cases, the 30-year Treasuries will see the greatest impact.  Given this duration difference, there will be a strong impact on the yield curve. Macro announcement effects are not just an equity risk premium phenomenon.  Unfortunately, like other studies this one focuses on the 5-minute intervals right after the announcement. This is good to know but it is more important to know what will be the impact over the course of the day.

Monday, June 10, 2024

The big head fake - global diversification


It has often been said that diversification is the only free lunch in finance, yet the free lunch has not paid off with international investors. Forget about global investing and emerging markets, just put your equity investments and you can do no wrong.  In this case, the home bias for US investors has been justified.  The US market has grown at a 13.3% annual rate since 2009 while the MSCI EAFA only gained 5.9% and the MSCI EM grew 3.2%.  Earnings in the US have grown since 2010 under world of easy money. Valuations have declined since the GFC, but the contraction has been greater outside the US.  The US has been on significant expansion except for the COVID shock, but the rest of the world has not suffered from any severe contraction. 

Is this all about the magnificent seven and the tech?  They are a key contributor to the US performance. There are no comparable companies in other parts of the world, so going forward, less diversification is based on the view that there will be no reversal in the magnificent seven, the rest of the world will not catch-up to the US and the higher valuations in the US will continue. 

Sunday, June 9, 2024

Is there are moral hazard problem from lowering rates?


There is a fundamental divide between the borrowers and lenders, between savers and consumers. The savers and lenders often represent the moral rectitude of being careful with spending and providing for the rainy day. The creditors are often given a negative moral view. Spend today through borrowing and put off into the future how it will be paid for. 

This question of borrower and lender behavior is closely tied to the price of credit. If the price of credit is too low, it will be viewed as cheap and will be used excessively.  There should not a be a moral association with cheap credit. It is just a price. If you can borrow at a low price, do it. Nevertheless, changes in the price of credit will change incentives and if the central bank can change the price of credit, it will change incentives. 

Hence, there is a potential moral hazard problem. Moral hazard can mean that parties will take on more risk under the view that the terms of a debt deal will later change. The debt problem associated with rates has been twofold. One, many borrowers expected rate to remain low for much longer. The normalization of rates came as a surprise. Two, now that rates have risen to higher levels, there is the expectation that the central bank will return rates to a lower level, one below the historic norms, to save borrowers from the ravages of higher debt costs. 

Borrowers can expect rates to decline, but their behavior should not be predicated on the notion that central banks will bring down rates to provide a lending bail-out. This moral hazard problem can apply to households, corporations, and governments. Borrowing should only be done based on the ability of a project to cover the expenses at current rates and not based on a belief that relief will come in the future for those who are willing to take the risk.