Wednesday, April 26, 2017

The real bias - stock optimists versus bond pessimists


During a simple discussion on investing, the topic turned to biases. We have learned to talk about a vast number of biases from behavioral economics. We now have a catalog of biases which makes them easier to mitigate, but there seems to be one bias that is very hard to address and that is the overarching theme of optimism and pessimism with managers. There may be only two types of managers - the stock buying optimists and the bond investing pessimists. I don't have empirical evidence for this but any casual discussion will usually tell you whether you are talking with someone who has a positive or negative bias.

The stock market optimist is the one who always finds good news on which to invest. They are driven by animal spirits that often cannot be measured. Buy value or buy growth. It does not matter. The optimist is positive on the future and looks for evidence to support this view. The theme may change but the result is the same. Buy investments that have long-dated future positive cash flows. It is hard to ever turn the stock buyer into someone who wants bonds or cash. They are always looking for the positive. Any move to cash safety is temporary while the manager looks to get back into optimistic investments.

This should not be surprising since an equity investment is a call option on the residual value of the firm. Increases in valuations are associated with growth and volatility. You have to be positive about growth prospects to hold a portfolio of call options.

The bond investor has a completely different mind set. Gains are associated with a decline in rates and a slower economy. At best, you receive your principal. Hence, the corporate bond investor is holding a portfolio of short put options on the firm and default free bonds. Even buying Treasuries, there is a desire for stability, safety, or protection. 

The negative correlation suggests that these investors have different biases especially if we are not faced with rising inflation. The bond investors will usually be talking about how bad the economy is looking and we are in a new economy of slow growth. Everywhere they look, they see signs of a negative environment. The equity investor will look at the strong rally since the Financial Crisis and will focus on the advantages of buy and hold even through difficult times. Their idea of a new economy sees further increases in the value of financial assets. 

You can call this entrenched asset class inertia. Pessimistic bond investors are going to need a lot of evidence to switch to risky equities. The same can be said of equity optimists switching to less risky bonds. Big changes in asset prices will be surrounded by the periods when this inertia changes.

Why is this bias discussion important? The optimist will have the bias of looking for positive information or filter information in an attempt to look for the positive. The pessimist will always use a negative filter and look for the bad news in the data. A model, however, will not have either bias, so systematic investing can eliminate this most fundamental bias.

Tuesday, April 25, 2017

Fat-tails everywhere even if volatility is low


I was reviewing an interesting research piece from Covenant Capital on kurtosis across different assets traded in the futures markets. They offer a spreadsheet tool that can allow anyone to find the number of fat-tailed occurrences relative to a normal distribution. The data show that there are fat-tails everywhere across all asset classes. We do not live in a normal distribution world. This should not be a surprise to most investors, but the important question is how do you effectively function in this non-normal world? Or, more precisely, how do you profit from this knowledge. 


We have been strong believers in the concept of investment strategies falling into two categories based on market convergence and divergence. Some investment strategies are better able to exploit the fact that the world is non-normal because they will perform better during extremes regardless of time horizon. 

If you live in a non-normal world, you will have to find strategies that will do well if there is a tail event. Nassim Taleb will say that you have to have some "anti-fragile" systems.  You could just buy straddles to take advantage of the wings but you pay a premium while you wait for these divergent events. Another alternative is to invest in strategies that can exploit large divergences. The simplest of these could be trend-following. 

Inherent in these divergent strategies are their success based on dislocations. If there is a trend that takes you to a positive extreme, the trend follower will buy and hold as long as that market continues to move in the same direction. There is no discussion on whether this is possible or not based on the fundamentals. There is no second-guessing. The strategies will make more money the further a market moves away from the norm. Given there is no view on normality, the strategy will do better when there are more extreme events. This strategy is "anti-fragile". 

There implications of non-normality go beyond just looking at strategies. Risk management based on normality is a loser's game. The investor will expect limited tail events that will actually occur more frequently and will be bigger than expected. The market has been moving to more sophisticated approaches to tail risk but these are still the exception and not the norm. Investment reward and risk are in the tails if you look closely.

Monday, April 24, 2017

Determine what goes wrong with your investment model


How do you know whether a model is broken? Or, how do you conduct a model review? There are many specific steps for any review but there are four major questions that have to be addressed that are separate from risk management. The key question of model efficacy should focus on forecasting skill and action. Does the model forecast correctly and is the model employed properly to make good decisions.

1. Is the data used by the model correct or timely? There is a wealth of data that can be used for building a model, yet this key input can be subject to delays and revisions. Hence,  the first place to look to see if a model is doing its job is with the data.  Many managed futures managers focus on price for the simple reason it is easy to get the data. The data can be smoothed to obtain a signal and the process of obtaining price data is cheap and efficient. This provides tremendous benefits for the investor. The same cannot be said for fundamental data. Any model with fundamental data is likely to have a delay issue, so data review is important.
2. Is the model using the data correct? It is clear that many financial models can only explain a small portion of the variation of the dependent variable. Additionally, models are subject to structural change when there are changes in the economy and there can exist alternative models that seem to fit the data but can still be wrong.  Simply put, is the model theoretically sound, structurally stable, and consistent?  This answer can change through time.
3. Is the interpretation of the model output correct? Given the low explanatory power of many models, there is still a lot of room for interpretation for what a model is telling us. The strength of the signal generated from the model can be weak. 
4. Is the mapping from model to a decision action correct? What separate modeling research from investing is the mapping from the model to a decision. If the model is given too much weight positions may be too large versus the strength of the signal. Too little weight and the model will not generate any excess return value.


Every investor who uses a model should have a regular model assessment or due diligence. We offer a simple four-step process for discussion purposes. The investor may want to have a deeper analysis with standards for quality control and forecasting skill. What is important is having a review process for model assessment. 

Friday, April 21, 2017

Follow the world business cycle - Economies are integrated


Globalization is a critical part of macro investing. There can be talk of separation politics, but for investors, you have to focus on the global economic cycle because the world is highly integrated. What is very interesting is that globalization has been fairly stable between the current environment and the Bretton Woods period as discussed by the recent work of Eric Monnet and Damien Puy who studied long horizon data available from the IMF. They find that there were two common shock periods which caused a highly synchronous global behavior. The first was oil shock period of the 70's and the second was the Great Financial Crisis. You could say that these were the two periods when "correlations went to one" across asset classes. There was no international diversification benefit. 


However, the output variance will vary across countries and time. If you want international diversification, you should focus on the countries that have the lowest variance explained by the world factor. The authors also found that which seems counter intuitive is that during normal times deeper financial integration tends to desynchronize national output with the world cycle.


What does this mean from a practical sense for investors? For US investors, following the US business cycle and the Fed is not enough. This may seem obvious, but it has to be a point of focus given this new data. When there is a common global shock, there is no safety with diversification, the global business cycle will explain more than half of country variation. There is also no reversal to the old days. The era of capital controls and fixed exchange rates still had a high degree of business cycle integration. Financial integration and output integration are not the same thing and they may be negatively correlated. Finally, the data says that you should know your shocks. When there is a common global shock, the world can get exceedingly small. 

Preparing for market risk - stay diversified across asset classes, factors, and strategies


You get recessions, you have stock market declines. If you don’t understand that’s going to happen, then you’re not ready – you won’t do well in the markets. If you go to Minnesota in January, you should know that it’s gonna be cold. You don’t panic when the thermometer falls below zero.
-Peter Lynch 

Simple advice for any investor. Accept that bad things will happen to markets. You may not know when, where, or how much it will affect markets but it will occur. There will be tail risk. The question is how you deal with it. Simple preparation can come through three dimensions:

1. Asset Class Diversification - The only free lunch of finance. Since you may not have any idea when bad times will come, the easiest solution is to diversify across asset classes that behave different across the business cycle. If a portfolio is concentrated, don't be surprised if there are periods when it will do poorly.


2. Factor Diversification - Look at the factors and structure or diversify. There are macro and micro risk factors. For example, some portfolios will be more sensitive to inflation. Others will be sensitive to the market capitalization. Small cap stocks will have more extreme moves around the business cycle. If you are not sure what you want with respect to factors, then diversify.

3. Strategy Diversification - Since many asset classes will often correlate to one during a crisis, asset class diversification may not be enough or the only solution. A second tier of diversification is through different investment strategies. Managed futures will perform differently during risk-off regimes as opposed to risk-on. Credit strategies will perform differently during different point in the liquidity cycle. Strategy correlations will generally stay lower than asset class correlations when there is a change in the business cycle; however, this may not be the case if there is a financial crisis. 

The performance cost from diversification may be less than the cost of specific tail risk strategies, so it seems as though diversification should always be the first line of defense against a negative market move.

Thursday, April 20, 2017

"Winner-Take-All" Dynamics and hedge fund investing


A growing stream of thinking in microeconomics is the concept of "winner-take-all" dynamics. The idea seems simple. A combination of networking economics and classic economies of scale creates situations where there are just a few dominant firms or economic agents who are able to capture significant market share in a given industry. With the advances in technology over the last decade, many industries are seeing the impact of winner-take-all dynamics leading to the result of greater concentration.

There have always been economies of scale with a firm, but there were limits based on geography, distribution, or just the ability to gain broad exposure. However, with the internet and the ability to communicate information broadly and quickly, the power of networking generates further economies of scale. 

There are some classic winner-take-all markets. For example, the music industry is dominated by a few singers who capture all of the market. Software, search engines, operating systems, or social media have all become winner-take-all markets. The first mover or close followers are able to gain strong market positions that cannot be broken by new entrants. 

We may now be seeing the beginning of winner-take-all dynamics with hedge fund investing. The combination of scale for investing with wide distribution has caused large hedge funds to get larger and more dominant regardless of performance. Think of winner-take-all networking and scale and you can see the how size matters more with hedge funds. We are moving from a highly competitive fragmented industry to one that is more concentrated. This will not happen overnight, but the signs of growing concentration are starting to be seen. Start-ups are slowing and smaller funds are closing.

Size allows for:
  • Economies of scale for passing due diligence - Passing due diligence for large investors requires more infrastructure from independent due diligence to redundant systems and independent trading. To gain money from large pensions, more scale is needed. 
  • Economies of scale with compliance - Regulation requires more compliance which is a large fixed cost. Scale spreads this fixed cost.
  • Broader distribution - The costs of marketing are high. This is not just visiting investors but providing investor relations and answering questionnaires. 
  • Platform access - More hedge funds need to be on platforms which have barriers to entry. Additionally, prime brokers want to only deal with larger firms.
  • Multiple products - Given the cost with reviewing firms, there is a desire for more products from the same firm. One stop shopping is gaining acceptance.
  • Matching with large investors - Concentration in banking and brokerage means that large firms will deal with other large firms. 
Is this good for investors? Scale will allow for the lowering of costs and allow for better infrastructure development. These lower costs can be passed onto investors. The better infrastructure developments in compliance, risk management, transparency, and investor relations all reduce business risk and provide benefits to investors, but the larger firms may not always perform better. Performance is just one aspect with the decision to invest. Now small have to perform better with excess returns to offset the higher business risks.

The idea that a smart manager can open a shop and attract investors to their new business may be ending. Performance as the key driver for new entrants may be ending.

Saturday, April 15, 2017

Factors, smart beta, and global macro


What has been at the vanguard of thinking in finance is the breakdown of returns into its constituent parts or risk factors. Finance has moved well beyond market beta. The primal breakdown for a portfolio is not returns by asset class but returns by risk factors. Some have criticized the current situation a factor zoo; however, even factor excesses does not change the fact that factorization is the paradigm used more and more by investors. 

There are many factors and many assets to map with factor weighting. The shear size of the problem lends itself to computerization and data mining. The role of the analyst as story-teller is diminished when a stock can be described through a set of modeled factor. Investors now buy risk premia not stories or names. Individual names are just the means to the end of gathering beta risks. Smart beta is just the realization that if factors can be used to describe stocks they can also be used to weight stock portfolios. This may be smart or it could just be the outgrowth from how the finance world is being viewed. 

Factors can be classified into two main categories: micro factors which are asset specific and macro factors which are related to macro events like the business cycle or changes in rates and credit availability. Hence, the type of hedge funds chosen by investors is bases on whether the manager focuses on micro or macro factors.


So what is the essence or purpose of global macro? In this new factor world view, global macro investing is a focus on economic wide factors which can be dynamically adjusted to generate excess return. Since factors move in and out of style or importance, the macro investor tries to find ways to exploit these changing weights. 

The issue is which factors are relevant for global macro investing. We are aware of the criticism of factor timing, so we have to be precise for what factors we are discussing.   Global macro has the overarching theme that the manager is trying to identify global business cycles or growth recessions which spill-over to the behavior of specific asset classes. Along with business cycle are credit and financial cycles which impact asset classes around the globe differently. The growth/inflation mix impacts policy choice which feed back on asset classes. What makes global macro so difficult is the low predictive skill by managers at forecasting these macro factors.

The difficulty with forecasting macro factors calls for managers to stay diversified, follow market trends, and take high probability tilts to specific factor opportunities. The poor performance for global macro is a function of the high uncertainty associated with the major macro factors. There is no smart beta in global macro if the macro factor directions cannot be identified. Global macro returns will only improve if the degree of uncertainty concerning growth, inflation, and liquidity falls to levels that allow for bets to be identified and managed.

The relatively better performance with managed futures programs is based on the core focus toward momentum and diversification and not fundamental macro factors. Managed futures captures macro events through the movement in asset prices, yet if there are no string trends there will ne only limited opportunities.

Friday, April 14, 2017

Populism and the economic laws of not following budget constraints


There has been a tremendous amount of talk concerning populism and politics, but for investors, the focus still has to be on the economic and market impact of these movements. Discount the news headline and rhetoric and focus on the potential market impact. Still, a good definition for populism is necessary for building a framework to determine risks.

So what is populism from the perspective of an economist? Populism, according to Sebastian Edwards and Rudi Dornbusch, two leading economists who have written on the topic more than two decades ago, is "an approach to economics that emphasizes growth and income distribution and deemphasizes the risks of inflation, external constraints, and the reaction of economic agents to aggressive non-market policies". The euphoria of any populist change must be tempered by the reality that there are limits to change. The risk is whether reality will temper behavior or whether extremism will lead to a crisis.

The reality of not following budget constraints and not using existing institutions is what defines populism for economics. This applies to both left-wing or right-wing populist upheavals. Current institutions and budget constraints should temper extremes in government and thus in populism. A populist government often begins as one that upends existing institutions and does not feel constrained by budgets and thus creates the potential for economic dislocations. The question is how far will this upheaval go and how much stress will be placed on the economy.

From an investor's perspective, it is important not to follow the rhetoric follow how budget constraints will be placed under stress and potentially broken. This is a risk that has to be assessed but often ignored. If the government tempers its behavior and stay within constraints, there is the potential for markets to remain relatively stable. If there is pressure to break institutions and budget constraint, there is the potential for large market dislocations. This is why we have focused on the two tailed risks of extremes at the beginning of the year.

Some of the political extremism has dissipated since January, but given the potential risk, we would argue that both left and right tail-risk exposure management makes sense. There is value in divergent hedge fund strategies that will make money if there is movement to market extremes. These are priced low given the current low market volatility.


Thursday, April 13, 2017

Stephen Ross of Arbitrage Pricing Theory (APT) fame died last month


Stephen Ross, the originator of the Arbitrage Pricing Theory (APT), died last month. He was a top finance scholar and the initial leader on factor investing. He was also one of the developers of the binomial pricing model for options and he was a co-author of a leading model on the term structure of interest rates. His work has been advanced by many others since his original research in the late '70's, but he provided the key foundations for a significant amount of finance that is used today. This does not even include his work on agency theory. 

Interestingly, it has taken a long time for much of this work to truly become mainstream. Factor beta is now the rage of finance for new fund development. His work on agency theory has influenced much of corporate finance thinking. His work on option theory provided a strong alternative foundation to Black-Scholes on how to price options, and his term structure work is a mainstay of any fixed income quant research group. Outside of the agency work, you can think of Prof Ross as Dr. Arbitrage. He was able to push the limits on the basic idea that returns can be decomposed and priced through reconstituting the parts or through some basic components. He truly showed the influence of arbitrage as the core concept of pricing assets and finance.

Wednesday, April 12, 2017

Commodity investing - Not for the buy and hold crowd


An article in the Wall Street Journal, "Why Commodity-Index Investing May be Futile" has gotten a lot of interest by investors although there was not any new information in the story. The reasons for avoiding commodity indices should be taken seriously; nevertheless, the broader issue of differences between commodity and equity investing is actually straight-forward. Commodity investing in an index of futures is not the same as a buy and hold strategy for an equity index, yet the factors that make it different are also the reasons for the lower correlation of commodities with traditional investments.  


Outlined below are the five reasons for why the WSJ thinks commodity index investing is futile and some elaboration on these differences. Simply put, different users and different markets will lead to different return outcomes. 


Is commodity index investing futile? No, but, a buy and hold strategy during a period of market contango and low economic growth is a loser's game. The idea that investors should just hold a long-term investment in a commodity index to get a range of commodity exposure has come and gone. 

There are a few key issues that have to be answered to be a commodity index investor even in the short-run. 

  • Where is the global business cycle? - Commodities peak late in the cycle and there generally has to be higher than expected growth to create excess demand for commodities.
  • Are there current supply shocks?  - Along with strong demand, commodity investing needs to expect or have supply shortfalls for prices to rise.
  • Are commodity inventories low? - For unexpected demand or supply shocks to significantly affect prices, commodity markets need to be in a lower than normal inventory environment.
  • Are commodity markets in backwardation? - The negative carry from market contango bleeds money for investors. Index investing needs backwardation condition in futures which has not been the case for most of the post Great Recession period.
  • Is there higher inflation? - While many have discussed the relationship between commodity investing and inflation, the link has been highly variable. Commodities have not been a reliable inflation hedge over the last ten years. Of course, this has also been a period of deflation or low inflation around the globe. Short-term dynamics and contango will dominate commodity index price moves in a 2% or less inflation world.
Commodity investing should be scenario-driven or situational and not buy and hold. Active management, where variable exposure is held in selected markets, may be a more reliable way of playing commodities. This can be done through sector exposure tilts to energy or agriculture or through active management of individual markets. This can be as simple as holding exposure in markets that show backwardation to some combination of momentum, carry, and fundamentals. Active commodity management is still difficult, so without strong conviction on the efficacy of active management, commodities should not be held as a core portfolio position. 

Friday, April 7, 2017

Declining economic growth and managed futures strategy returns - Is something there?

Another simple test to determine whether managed futures returns will do better than average is through looking at economic growth. Now, we know that bonds and other defensive assets like managed futures will do better in "bad times" such as a recession, but there just are not many recessions. The cost of being defensive can be very high if you have to pay for downside protection through either explicit insurance or through holding assets that have a lower expected return. 

The alternative is to think a little more broadly about the definition of "bad times". The deviations for growth or growth recessions are also periods when defensive assets should do better. If there is a slowdown in economic growth firms and market prices will adjust. Price discounting will occur when growth slows. Inventories will build during growth slowdowns. Investors will be more cautious.

A simpler test for defensive assets is to look at the deviations from trend growth. A simple index of deviations from trend growth that incorporates a significant amount of economic information is the Chicago Fed National Activity Index. If the index is negative, then economic activity is below trend. Positive values suggest economic activity is above trend. The switches between above and below trend growth are clear and these are the transitions that offer trading opportunities.

It is noticeable that there has been little deviation from trend since the Great Financial Crisis. The current period may be a better representation of the Great Moderation than the mid 1990's. The difference is that the deviations seem to be closer to the trend. This does to mean that we have exception growth in the current environment but only growth that is closer to trend. We show in green the 12-month rolling average value. 

This research on "bad times" is ongoing but we have found that returns for managed futures are slightly higher during periods of declining or negative deviations from trend. This mean difference has a p-value of .2 for a one tailed test which suggests a weak difference. Our analysis shows that performance for managed futures is higher than normal when there is a deterioration of financial condition versus periods of just slower economic growth. Our ongoing research is to look at the impact of "growth recessions" on other hedge fund strategies.

The crisis alpha that may exist in managed futures shows stronger performance during market downturns, but more importantly, managed futures performance is tied to changes in economic performance. Deterioration of financial conditions or growth, the harbinger of a possible asset price crisis, are the more primal cause of excess returns.

Thursday, April 6, 2017

The Fed as SOB - Seller of bonds, Overvalued view of stocks, and Biased upwards with risks


The just released FOMC minutes provided a lot of information on Fed and shows they are real SOB's.  

Sellers of the balance sheet. We learned that the reduction of their Treasury and mortgage holdings may begin as early as the end of this year. The market has been waiting for this day for a long-time. Now it may become a reality and that changes the dynamics of the Treasury and mortgage markets even if it is just a proposal of not reinvesting interest and maturing bonds. The Fed balance sheet is now $4.5 trillion, so there is a lot to sell. There will now be the new issue of balance sheet uncertainty for investor to face. New marginal buyers will have to be found and it will unlikely be at higher Treasury prices. This is not the same as a rate hike. We don't know the impact of balance sheet reductions.

Overvalued risky asset view. There was talk in the minutes that equities may be overvalued relative to standard models. This should not be considered new news and it should not be a surprise to have the FOMC mention it, but it is always sobering to read central bankers noticing and discussing overvalued financial markets. Investor will have to watch what the Fed may be watching to see if financial markets will affect policies.

Biased risks to upside for growth and inflation. Finally, we have an idea of their view on risks and their general bias is that risks for growth and inflation are more to the upside. If risks are toward the upside, there is less reason for a cautious Fed. 

These FOMC minutes tell us that this is not a Fed steeped in extreme caution, but one that is planning the reversal of the big monetary experiment and may be worried about being behind as opposed to ahead of the curve. Of course, these minutes said the economy is doing well and can handle Fed normalization. That may be true, but markets react to policy on the margin. Investors have been euphoric, but now we have less reason to expect fiscal policy help and a central bank that is full speed ahead on normalization. This is bad for risky assets. This is bad for stocks and bonds. Time to get more defensive with investments.

Equity hedge funds doing better for month and year


Systematic and global macro managers have a hard time with turning points and market reversals. March is a simple case study of that truism. While many equity hedge funds made money in March, the macro crowd was a net loser. With reversals in bonds and currencies and relatively range bound behavior in commodities, there was little room for return opportunities. March performance pushed macro managers into negative territory for the year. On the other hand, equity hedge funds showed good returns consistent with their generally lower beta exposure. 

There have been a growing number of stories on the poor performance of active managers including hedge funds. The number of fund managers outperforming benchmarks is near all time lows, yet some research shows that this under performance seems to be cyclical as opposed to a long-term secular trend. With more discussion of stock market overvaluation, this may be a year where the stock-pickers are able to show their value through avoidance of the bad firms. With macro changes and overvaluation in many markets, this is an opportunity for active management to prove their worth.

Wednesday, April 5, 2017

Global macro in one page - Rotation to non-dollar assets continuing

March was a tough month for making any economic judgments. The Trump rally in equities was expected to continue, but reality has been a switch to non-US risky assets. A bond sell-off was expected given Fed action combined with more fiscal policy revelations. It did not happen. The dollar was expected to continue its rally based on further confirmation of the Fed being out of step with other central banks. It did not happen. 

In reality, stocks were ranged to the downside, bonds rallied albeit still in the range for the year, and the dollar sold-off on Fed action. Perhaps euphoria about fiscal policy change clouded the reality of current macroeconomics. We are neither in a strong secular stagnation or meaningful financial cycle adjustment, but the environment is still not ready for a new era of growth. Further upside in rates, the dollar, and equities will only come with a clear set of less uncertain policies and that is not likely this quarter. 

The market focus has to be on the simple core of macro forecasting, real growth, inflation trends, capital flows, and central bank action. The emphasis has to be on what is and not what policies might be. Of course, forecasting is forward-looking, but given the level of uncertainty, the trends in economic data and actual prices are what should dominate and if the trends change, opinions have to be flexible and also change.

Tuesday, April 4, 2017

March showed a rotation in return performance


March saw a significant rotation in return performance from US equities to global and emerging markets and from value to growth. Our indicators show prices are starting to break to the downside albeit trends are currently flat. March was a transition month from euphoria to reality concerning US government policies. Future price direction will be determined by the real economy and not policy expectations.

There is a growing dispersion across sectors with energy, finance, and real estate showing strong loses for the month. Technology and consumer discretionary sectors were the only two sectors which showed strong gains and maintained good returns for the quarter. Those sectors expected to be most affected by Trump policies showed the largest reversals.

Country equity ETF all showed good returns for the months and quarter except for Canada. Clearly, opportunities outside of the US have been appealing for risk-taking investors. A major turn-around in Mexico suggests that the concerns about trade wars have significantly dissipated.  


International and EM bond ETF's have shown positive returns for the quarter even after accounting for the moves in the dollar. Long duration and credit sectors lost money for the month, yet year to date returns are still positive in spite of the change in Fed policy perceptions.

March was a transition month as we started to move through this process of sector rotation. Up trends have flattened and return dispersion has increased. Whether we switch to stronger downtrends or more capital rotation is now a function of economic growth. However, the link between the real economy and asset prices can be highly variable. Bond markets are signaling a weaker economy while equities are suggesting more robust growth outside the US. These divergences in market behavior mark periods of potential dislocation.

What to expect from big managed futures managers and what you need to beat them


What should investors expect from the largest managed futures managers? We can gauge expectations through looking at the average return and volatility for the component managers of the BTOP 50 index. We looked at the most recent three year period and calculated the annualized return and volatility. The average return for this period was 4.79 percent with an annualized standard deviation of 11.5% for the managers. We then calculated the standard error for the mean and the standard deviation and placed all of the return and risk combinations in scatter plot. The oval represents one standard error in each dimension - return and risk. 

Clearly, there will be managers who will be outside the error range of approximately 2.5 percent for the mean return and 2 percent for volatility. These numbers will change with the sample size of managers. The BTOP index constitutes 50% of the AUM in managed futures and is currently represented by 20 managers who are equally weighted. These numbers will differ from the actual index because we use the current components of the index and annualize the yearly returns of the managers. We use the stated monthly standard deviations of the managers.  


Looking at a breakdown of returns by year shows that 2014 was a very good year while 2016 was difficult for large managers. It is clear that returns are highly correlated and driven by the same set of factors.

These returns provide a good benchmark for any manager who wants to compete against the largest reporting. In a perfect world, you will want to generate higher average returns with lower volatility. Over the last three years, you would want to have a volatility of less than ten and a returns over eight percent to be credible. Of course, the excess return and lower volatility has to be enough to compensate for the potential business risk of being a small manager not in the index. 

Looking at the scatter plot provides some interesting insights. No managers were able to  generate annualized returns of more than 6 percent annualized over the last three years with 10 percent volatility or less. In fact, there was only one manager that generated more than 10% returns regardless of volatility. Information ratios were all below one and only two managers generated ratios above .9. Of course, three years may not be enough data to truly measure the success of a manager but it does provide a good starting point for analysis.

Monday, April 3, 2017

Managed futures cannot find returns on market reversals


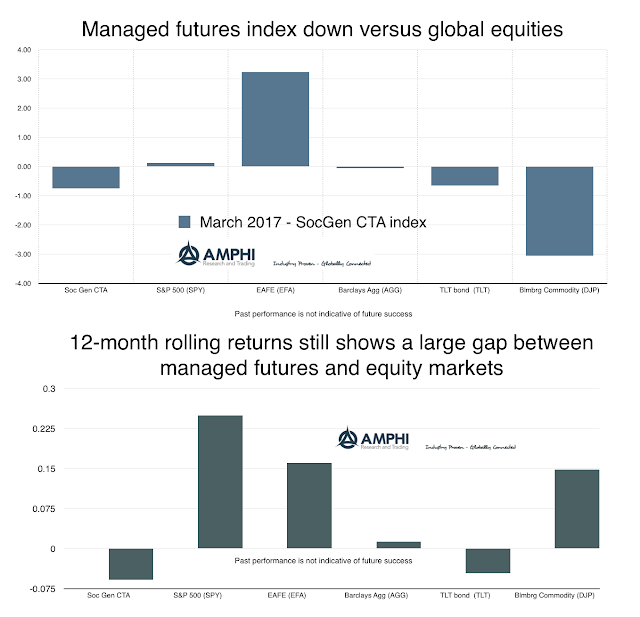
Managed futures declined on market reveals from the Fed FOMC announcement of a 25 bps rate hike. While the move seemed to have been baked into market thinking before the announcement, key asset classes revised trend direction after the 15th. The SPX, which was already flattening in trend, turned lower. Bond returns, (long duration), actually turned higher on a perceived more aggressive Fed. The dollar strength reversed and commodities moved higher after declining for the last month. You get the picture on the change. Trend-followers saw a reversal in performance which added to a lower overall return. 


Looking only at monthly asset class return numbers will not show the trend reversal although a poor bond and currency month and declining commodity prices will provide a good tip that managed futures would not post a positive gain. 

The gap between managed futures and equities is especially wide on a 12-month rolling average because the first quarter last year was so poor for equities. We expect the return gap will start to close as equity returns are normalized and managed futures finds better opportunities with the end of the post-Trump reflation euphoria period.


LMEprecious - Joining the futures world?


Any managed futures trader will tell you that trading metals on the LME is much more difficult than other "futures" contracts. Structural differences make for a more challenging environment from monitoring and capital usage to transaction costs. The continuous forward contracts of the LME are just more difficult to trade than the focused discrete delivery dates of futures because market liquidity is spread over a wider set of dates. Even if liquidity is centered at a three month prompt, the liquidity on exit before expiration may be more difficult to find. 

This liquidity difficulty may be offset by the greater flexibility in contract expirations at the LME versus a futures contract. Hence, hedgers may find the LME a more attractive alternative than the traditional futures contracts which have greater basis risk from the limited contracts expirations. Speculators, on the other hand, who place a premium on liquidity and consolidation of order flow will find futures contracts more appealing. Nevertheless, it always becomes an issue of networking. Pardon the language, but traders trade where others trade. However, for speculators, there always is a choice of just avoiding markets that are more costly and difficult to trade which hurts overall liquidity and development. Market design matters. 

These costs and issues show up in the convenience yield for different market participants. The convenience yield embedded within the futures price includes the cost of transacting but creates noise in the price discovery from the full cost of carry relationship. The convenience yield associated with using LME is higher for hedger because they can hold a forward that matches their industrial needs.  The convenience yield for speculators is lower because the round-trip cost and uncertainty of liquidity is higher. Contract and market design has to be structured to minimize the dispersion in convenience yield to allow for maximum price discovery and minimum basis risk. 

The reason for this discussion is that the LME will be offering new gold and silver contracts called LMEprecious that will have most of the characteristics of a traditional futures contracts and will not take the traditional form LME forward contracts. The LME has introduced other forward contracts that are more futures-like to consolidate liquidity and trading at specific points through their third Wednesday contracts. 

The new LMEprecious contacts for gold and silver when they launch in June, will be subject to the same difficulties of most new futures contracts. New contracts will normally be relegated to failure with an occasional success. The success or failure of the futures contract will be based on its ability to gain a network and scale with liquidity and trading. If there is no liquidity, the trading convenience yield will be outside the range of other comparable futures contract with no mechanism for arbitrage, a market failure. However, the LME is doing more than most to help with success of these contracts. From the World Gold Council to selected dealer banks, the LME has attempted to solve the network problem on day one.

The gold market is especially crowded with alternative markets structures, in New York, Shanghai, and the host of OTC alternatives. Any gold contact has to overcome three structural issues: geography, (the market is moving east); clearing (the market is moving to centralized clearing and away from OTC), and liquidity (the market will always seek the highest liquidity place for trading). However, some strong trading backers, centralized clearing and the new regulatory regime may give LMEprecious a good chance for survival and a meaningful share of the gold trade.

Sunday, April 2, 2017

Trends and break-outs - No strong directions for any sectors


For most managed futures managers, the modeling task is simple, look for trends or break-outs. Managers are not predictive but reactive to what market prices are doing. Looking at the current price data across the major sectors provide little evidence of strong trends or break-outs. Trends that seem to be currently developing are not strong enough to move beyond recent highs, so our trend sector matrix is showing sideways to a slight up moves across most sectors with the only strong trends in commodity markets. 

These sideways indications do not mean that there won't be strong trends in April. It just says that trends at the end of the month were limited and any extrapolation will suggest limited returns. There were a number of strong trend reversals upon the FOMC announcement of a rate hike in mid-March. This central bank action and commentary arrested moves in currencies, fixed income, and rates especially within the US. The best trends may be in non-US global stock indices and fixed income. 

The signals from price tells us the positive sentiment trades for Trump policies are being reassessed with non-US markets moving to a growth reflation story albeit one that is still modest by comparisons with the past. Generally, the markets have lost a clear direction from the macroeconomic environment. Commodity signals tell us that supply imbalances still exist and the work-off of inventories will take some time as long there are no surprise demand shocks. 

We may be surprised later in the month, but April returns currently will have limited tailwinds from March trends that could drive managed futures performance. 

Saturday, April 1, 2017

Strong non-US returns for the quarter - end of the Trump effect?


The capital flows and returns for the month and quarter tell a risk-on story for global markets. This is not the case for the US where equity returns were at best flat and bonds showed negative returns in March. The dollar sold off for the month by slightly less than one percent as measured by the DXY dollar index. Even if we account for the dollar tailwind for international stocks, global equities did better than the US by well over 2% for March. Emerging markets have seen the best quarter in years with double-digit returns. Adjusting for the dollar would have placed international and emerging market bonds in-line with US bond returns. 

We are a long way from the threat of a global slowdown based on trade wars. Similarly, we are a long way from the early Trump rally in US equities driven by bold tax reform and fiscal stimulus programs. All tax reforms have always taken longer than expected and there is no special magic with the current Trump administration at moving an agenda. Similarly, we have seen the problems with moving "shovel-ready" projects through Congress. Spending programs such as infrastructure development take time to move through the legislative process. Hence, the euphoric sentiment in US stocks has been tempered and the value for non-US markets has taken on new life with the higher expectations for global growth.

Fixed income has fallen in-line with a higher global growth story, stronger inflation numbers, and a Fed that is tightening faster than expected earlier in the quarter. The numbers tell us that we are close to optimal targeting for unemployment and inflation. Inflation itself, as measured by the latest PCE inflation index numbers, is closing in or around 2% but does not seem to be in an overshoot mode. Hence, bonds have not seen a large sell-off in March and still showed positive returns for the quarter. The outlier on the downside has been commodities which sold-off in many key markets. 

Using financial conditions to see when crisis alpha is needed


Financial conditions can inform us about periods when there will be crises and market dislocations. The graph above shows the time series for the Chicago Fed adjusted financial conditions index. The index measures liquidity, risk, and leverage in money, debt and equity markets as well as measures of traditional and shadowing banking. If the index is positive (negative), financial conditions are looser (tighter) than average. A close look will suggest that when financial conditions are tight corresponds to periods when there has been a crisis. Generally, these have been period when the markets are moving to or in a risk-off regime. The change in financial conditions tells us something about transition in markets. If the index is moving from negative to positive, financial conditions are tightening. A decline in the index suggests that financial conditions are deteriorating.

During these periods of transition, divergent strategies such as managed futures should do better than other periods when financial conditions are good and there is a risk-on regime. In particular, we are looking to see if tightening or deteriorating financial conditions are periods when managed futures do better than average.

We have conducted some simple statistical analysis and found that what may seem obvious on a graph may actually be harder to find when looking closely at the data. We divided financial conditions into subsets based on whether the index was positive or negative and either moving higher or lower. We then compared these periods with the subsequent three-month returns for the BTOP 50 managed futures CTA index. We find that whether financial conditions are positive or negative does not really matter, but the change in the financial conditions does matter. If financial conditions are deteriorating, then subsequent BTOP index returns will be stronger than non-deteriorating periods and the average three-month return. However, there is little difference in managed futures returns during periods when financial conditions are loosening. Tightening of financial conditions lead to more market divergences. Unfortunately, a simple test for significant will find that these are not significantly different from average at anywhere close to 90% confidence. 


Right now, financial conditions seem to be looser than normal and not at all tightening. By this description of the market, managed futures returns as measured by the largest managers who are usually trend-followers will fall into a normal range.