Tuesday, November 29, 2022

Stagflation and debt traps - The twin problems that are not going away


Nouriel Roubini - "we are facing a stagflation and debt trap." 

Professor Roubini is known to many as a Dr Doom, but he has proven to be good at framing the problems we face. The timing may be off on when these traps will bind investors, but there will have to be a day of reckoning. 

We have been facing a debt problem since before the GFC. Overall debt was high prior to the GFC. After the GFC, households retrenched, governments did not, and corporations used low rates to lever their balance sheets. This was not an issue when at the zero bound but times are different. In a rising market environment, debt was not an immediate problem. Debt was matched by higher asset values and growing wealth; however, with at best a stall in wealth, balance sheets are deteriorating as debt burdens increase.

Stagflation only makes the debt situation more precarious. Inflation is good for debtors. Think of all the negative debt that was destroyed as rates moved to positive. Yet, new debt and existing debt that must be rolled-over will be at higher rates, and the stagnation in growth diminishes the ability of households and firms to pay-down this higher rate debt. Government debt is not immune to stagflation, but increases in inflation support higher tax revenues. 

Of course, these are generalization and that in of itself is a problem. Inflation and low growth create uncertainty and ambiguity of what prices will rise and what will remain stable. Low growth reduces potential new investments. Firms will fail. Firms will not invest, and households will change their spending patterns.

Monetary policy should be restrictive to reduce inflation, but raising rates only enhances the debt problem. Funding costs increase which increase defaults and bankruptcies; however, relieving the debt problem will prolong the inflation problem. A solution to one trap supports the other problem trap. Neither can be solved.  

Debt coupled with stagflation create a negative feedback loop. More of either will extend both  problems.

Rereading Kindleberger - Institutions Matter


With a new book by Perry Mehrling, Money and Empire: Charles P. Kindleberger and the Dollar System, the interest in Kindleberger's writing and thinking should increase. Of course, most remember him for his work on speculation, Manias, Panics, and Crashes (1978), but he was deep thinker on economic history and the role institutions to affect policies. In an era of mathematical modeling, Kindleberger was a throwback to a different period when looking at institutional structures provided clarity on how market worked or failed. 

He wrote an important history of the Great Depression which is often lost to other works that attempt cast the Depression through a specific economic model lens. He wrote with clarity about the events leading to the Great Depression without a strong bias. It was not a monetarist or Keynesian problem but one based on the failure of policy, foresight, and institutions. 

Kindleberger wrote about the life cycle of nations and the importance of institutional arrangements for well-functioning markets. This was done through digging into the history and not through model abstractions. 

Of course, we need models, but we also need deep institutional analysis to look beyond models and decipher why market failures may exist. To place Kindleberger in context, institutional arrangements matter whether for panic and crashes or policy success and failure. 

Some great Kindleberger quotes plucked by Mehrling for his book,

“The model for the world should be the integrated financial market of a single country, with one money, [and] free movements of capital at long and short term.”

“When markets don’t work, don’t use markets.”

“Governments propose, markets dispose.” 

Wednesday, November 23, 2022

Trend-following returns - It is all about macro volatility


The big trend-following strategy question is whether the strong performance of the last year can continue in 2023. The answer is yes for three reasons. One, volatility has been high and will continue to be high given the current economic uncertainty. Two, the current economic environment is more the norm versus the calm post-GFC period. See "Trend-Following: Why Now? A Macro Perspective." Three, trend strategies go both long and short and can reverse positions if there is a change in market direction.

The 2010-2020 was the lost decade for trend-following not because there was anything wrong with the strategy but because the macro environment was so stable. The stability paid handsomely to those who held a 60/40 stock/bond portfolio. If there are no major changes in macro fundamentals, there is little reason for prices to see extended trends. However, when there is strong fundamental volatility, it is likely to persist.

The combination of constraints on central bank policy choices, higher inflation even if dampened, a looming global recession, geopolitical uncertainty, and global economic uncoupling, we are more likely to see high market and macro uncertainty. 


The actual performance over the next 12 months given a strong prior 12 months is not significantly different from the median 12-month return. Returns likely be lower in 2023, but the chance of a major reversal or drawdown is not likely. For example, commodity prices moved off their March highs and trend-followers were able to rotate their risk exposures to the short-side and generate returns in other asset classes. This type of position rotating is likely to occur again next year.


Trend-following versus options - Finding cheap convexity


While many focus on the value of trend-following as a strategy for uncorrelated returns that will do well during a crisis, there is another story based on convexity. Given trend-following exploits divergences, it will do well during market extremes and provide positive convexity. 

These two narratives are closely aligned but represent different views about the strategy return profile. Trend-following has been classified as being a set of long straddles. The long straddle story focuses on trend-following as a long convexity or divergent strategy regardless of market direction.  

With trend-following being long convexity, a discussion naturally focuses on the different ways of obtaining convexity. It can be generated through capturing trends, or it can be obtained through purchasing options (straddle replication). A simple question is asking which is better. See "Creating Portfolio Convexity: Trends versus Options"

Over the short-run straddles will provide more convexity than trend-following but the cost if markets do not move is high. Stand-alone returns may be negative. On a rolling 3-month basis, trend-following may generate more convexity. This convexity is especially strong during worst quantile of returns, and may come from different asset class sources. 


There are various ways of obtaining downside protection from options but all are expensive. The cheapest way for getting convexity may still be through trend-following even though it is an imprecise way of obtaining this long convexity.


Tuesday, November 22, 2022

Exploit style momentum - Track the style leaders


There is momentum in stocks as well as in other asset classes. There is also momentum in factor styles. Using a simple momentum model with an optimizer that goes long the high momentum styles and short the low momentum styles and accounts for the variance/covariance matrix generates an IR well above a simple strategy of rank ordering by performance. See "Can Style Momentum be Optimized". Momentum is everywhere; however, if you account for risk you can improve the return to risk profile for a momentum-based portfolio.


Using an optimizer will add significantly to the IR relative to a simple long/short strategy. In many cases, the IR is doubled.  

The factor contributions tell us something about the return potential and uniqueness of different factors. Beta and liquidity do not add any to performance but something like industry momentum and a ML factor are strong contributors.


Simple common approaches such as momentum and accounting for the variance/covariance matrix can go a long way for providing good risk-adjusted returns.

Monday, November 21, 2022

The Bullard framework using the Taylor-Rule


The Taylor Rule can be employed to provide some precision in our thinking about the Fed's interest rate path. The market is constantly being bombarded with Fed governors, Fed presidents, and market pundits telling us what will or should happen to rates, but few reveal their model for generating their opinions. 

A recent speech by St Louis President Bullard provides a strong simple framework for the Fed rate discussion. The Taylor Rule can be used as a model for suggested future changes in rates. This is not a dynamic model, but it can provide an idea of what could be the terminal policy rate. See "Getting Into the Zone"

The Taylor Rule is a policymaking workhorse for suggesting the appropriate policy rate. It is problematic at the zero bound, but in the current environment it can be very useful. The Taylor Rule forecasts the effective policy rate by looking at a simple equation based on a few key inputs. The recommended policy rate will be a combination of the inflation target which is currently 2%, the neutral rate of interest, R-star, which is currently between -.5% and .5%, the output gap, which is currently zero, and the inflation gap between current inflation and the policy rate with a sensitivity variable usually set between 1.25 and 1.5.  

Bullard generates a generous and less-generous recommended policy rate path which can then be compared with current rates. The difference between the current policy rate and the Taylor estimate is a rate gap that will be needed to be closed. By measuring the inflation path through time, we can figure out how the gap will be closed, either a by a slowdown in inflation or an increase in rates. If inflation slows, we will reach the sufficiently restriction zone faster. If the inflation remains stuck near current levels, rates will have to be increased further. 


Playing with the input values will give us a good idea of what it will take to get to an appropriate rate level. Under this scenario approach, we can get closer to the right policy through a couple of rate increase combinations. If the PCE inflation stays stable, we can get to the lower bound or generous level through a 75 and 50 bps increase or two 50 bps and a 25 move. If we have a view that we want to reach the average value which is between the less and more generous number, we will need more increases. A 50 bps increase in December, 50 bps in February, and 25 bps in March will get rate into the bottom of the sufficiently restrictive zone.

Sunday, November 20, 2022

What drives mistakes in equity accounting data?


The P/E ratio can a great measure of value. The P/E ratio can a poor measure of value. It is both. You will get a distortion when earnings are not properly measured. 
  • No earnings problem - If there are no earnings or earnings that have just turned positive the P/E ratio will be distorted. Without some smoothing, the value can be a noisy signal.
  • Accrual accounting - The difference between net income statement and cash accounting can be significant if there are significant accruals. A place for value fantasy is with bringing income forward that will not be earned until the future.
  • Inclusion of equity investments - Non-realized gains and losses on investments as a part of income are causing more fluctuations in earnings that are unrelated. Equity investment fluctuations create noise versus what a company is earning on a cash basis
  • One-time events - One-time events have to be taken out of numbers. They have an impact on cash flows, but valuation is about measuring the ability of a firm to make money through time and have assets that are mis-priced.
These accounting issues are critical for systematic investing that is looking for meaningful fundamental information. Without adjustment for all these one-off events, a model can just be an exercise in outlier detection.


Engaging investors - The key to success raising money or sharing ideas

 I can think of nothing an audience won't understand. The only problem is to interest them; once they are interested they understand anything in the world.

 - Orson Welles

The Welles quote focuses on the key purpose of narrative, create interest. Narrative drives investment capital and serves as the catalyst for action. The effective narrative generates interest and understanding, yet many managers forget this simple lesson. 

Numbers don't have feelings. Numbers by themselves don't provide context, so there is no interest. The good narrative explains why numbers are important and can provide comparison. "These numbers are like..." "These numbers are extreme..." These numbers are odd..." 

A z-score is just a scaled number until it is suggested that it is interesting at this time and place. A trend signal is just a price above some average until it is made interesting by explaining how it fits within an economic story. An economic model is just a forecast until it is given an explanation for why the forecast may be unusual or have meaning for action. 

A story does not have to be an exaggeration or a marketing pitch. It does have to cause the audience to say the following, "Tell me more."  

Wednesday, November 16, 2022

ARK and commodity deflation risk - Don't think so...


Catherine Wood of ARK Invest send an open letter to the Fed concerning her fears that we may face significant deflation risks. This argument was reinforced with comments that the current markets are like the 1920's when commodity deflation and tight money preceded the depression. See ARK extends open letter to the Fed.

A comparison between the returns over the last year, five years, and from pre-GFC tells a very different story. Commodities have come off cyclical lows but have not, in some cases, reached post-GFC highs as measured by some broad-based commodity indices.

Commodity markets are off the extremes from the beginning of the Ukraine-Russia War and the pandemic, but it would hard to argue that we are entering a deflation period. The last few years have been a catch-up from super-cycle lows. 


There are always three cycles in commodities that drive longer-term price moves. One, there is the commodity super-cycle which is associated with long-term investments and long-term demand. Growth shocks like the ascent of China with under-investment will create a super-cycle. Second, there is the business cycle. A slowdown in global growth will create commodity excess supply and price declines. Third, there is the weather cycle that may create crop shortages. These are more market-specific shocks, but weather patterns like La Nina create cyclical price changes. Before we start with the deflation fears, let's make sure we understand current commodity cycles.


Tuesday, November 15, 2022

The Bezzle and FTX


It is hard to get a full handle on what happened to the FTX exchange and the crypto market in the last week. We know that FTX filed for bankruptcy. We know from filings that the liabilities exceed assets which may be at inflated levels. We know that customer funds are frozen, and they were used to support the FTX trading arm. We know that FTX is both a cause and casualty of a crypto-bubble popping. 

We should not be surprised by this story. We have seen it before. It has occurred during other periods of market excess. The bezzle is the period when an embezzler has his gain, and the victim has no loss. Charlie Munger would refer to this financial illusion as the febezzle or functional equivalent of the bezzle when psychic wealth is created even without illegality by mistake or self-delusions. This was the period before the FTX failure. 

We have moved from Galbraith's bezzle to bankruptcy. As Buffet would say, the tide has moved out, and we will find out who is wearing swim trunks. There was Ponzi, the Match King, Madoff, and assorted other characters during bubble who made wild promises only to generate a house of cards. Sam Bankman-Fried may be added to this list, a persona based on a flim-flam mixed with hubris, poor management, and hucksterism.

We will now have an investigation. There will be more regulation which is late to solving the problem. Participants of the exchange who had funds at FTX will take losses as general creditors, investors in the company will write-down investments, and we will ask how this happened and tell tales of greed and excess which will serve as a warning for future investors. It will happen again. 

Once again - greed, FOMO, and ignorance play a key role with investors parting with their money. The big tale of crypto taking over finance is over. The only story will be about a bubble and its aftermath.

Sunday, November 13, 2022

Be a data detective - Now more than ever


 Tim Harford has written a good short book on the being a good data detective; however, we can make it much shorter. Be a skeptic and be curious. The skeptics never takes anything for granted and the curious investor will ask for better answers from your skepticism. This would make for a short book. Harford begins by referencing the old book How to Lie With Statistics by Darrel Huff and tries to address how to avoid statistical traps at a high level. 

Harford provides ten rules for being a good data detective are:
1. Search your feelings.
2. Ponder your personal experience.
3. Avoid premature enumeration.
4. Step back and enjoy the view.
5. Get the backstory. 
6. Ask who is missing. 
7. Demand transparency when the computer says no.
8. Don't take statistical bedrock for granted.
9. Remember that misinformation can be beautiful, too.
10. Keep an open mind. 

The key is not accepting what is given you as data and not accepting the conventional wisdom or use of any data.

Curiosity solves the information gap between what we know and what we need to know


We have referred to uncertainty as the gap between what we know and what we need to know. Uncertainty is the information gap and curiosity is the desire to close the gap. Curiosity is the core to being a good analyst and data detective.

For investing, it can start with just asking the simple question, "Why did the market move?" The investor who is not curious will say that the market moved higher because there were more buyers than sellers. It may not be said this simply, but it can be variation of supply and demand. The curious person will look for a cause but not a correlation. Yes, there was a new event but does that event explain the market move? Curiosity will be more than just looking at a news report that happened at the approximate time of the price move. 

It can also apply to data. Where is the data coming from? How is it created? How is revised? Does it have delays? Is the data from one country the same as another?

We must fight the "illusion of explanatory depth" which stops us from digging deeper. A single level of depth or explanation may not be enough. 

Inflation came in lower than expected so that is the reason for the market rally. This may be a good explanation, but it is not clear it is the right one. It may be the right one, but can it explain the size of the move? '

Can there be a limit to our curiosity, especially if you are a systematic modeler? No. The quantitative framework provides a framework for looking at countable events and repeatable responses. It allows a manager to focus on what is not countable and may be out of the ordinary.

See 

Risk and uncertainty - The problem of closing the knowability gap

"I am uncertain" vs. "It is uncertain" - Internal Versus External Uncertainty


Thursday, November 10, 2022

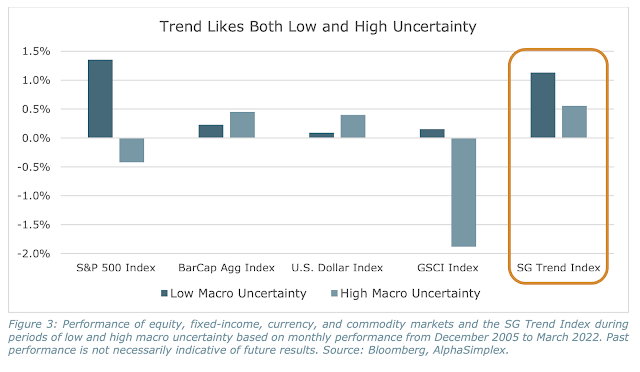
Trend-following good in both high and low uncertainty periods


While trend-following does well over long-term horizons, there are periods or regimes when it will do better and worse than other asset classes. The regime focus has often been on the crisis alpha or the period when equities decline, but those periods are relatively infrequent and hard to predict. Another regime breakdown could be based on uncertainty as measured by the volatility across asset classes. An interesting research piece finds that trend-following does well in low and high macro uncertainty. See "Managed Futures and Macro Uncertainty: Navigating the Extremes".

There is an ebb and flow with macro asset class volatility that is measurable. The SG trend index does well in both low and high uncertainty environments. It is the middle range that is a problem. 

Think of trend-following as a signal to noise problem. Trend-followers will make money when the signal from trends is high relative to the volatility of the markets. In a low volatility environment, a given trend signal will be strong all else equal. In a high volatility regime, the signal to noise falls, but it is generally found that trends are more likely in a high uncertainty environment. Investors become more cautious with their decisions and delay action. Hence, there can be good trend returns in a high uncertainty period. The slower to react investor story can explain why trends may do well in rising uncertainty and do less well in falling uncertainty environments. 

Think about the environment to make judgments on trend performance.


Wednesday, November 9, 2022

Asset returns can tell us the economic regime - Conditional returns matter


Asset returns are conditional on the market regime. We define some exogenous regime and then look at what were the returns for different assets during that regime. However, there can be another approach to looking at return data and regime identification. We can look at the pattern of returns and then identify a regime.

The overall return distribution for an asset or set of assets may be a mixed distribution based on returns and risk during different regimes. The unconditional returns are a combination of conditional clusters. There are models that can find the set of return regimes that make up the unconditional returns, for example, the Gaussian Mixture Model (GMM). The researchers at Two Sigma used this type of model to identify four main regimes across asset returns based on the clustering of their information on the 17 different factor returns. See "A Machine Learning Approach to Regime Modeling"

The four regimes identified from this GMM model can be called: crisis, steady state, inflation, and walking on ice (WOI), the period around crises. These names are not based on a review of the economic environment but on the clustering of returns across all factors. After the clusters are identified, they can be named based on a look at the environment. 


This work is important because it tell us that regimes matter and market returns cluster around a few key groupings. A judgment on stocks and its regime cannot be isolated from returns across asset classes and factor returns.


Trend-following and rising rates – A world of difference


There is the old view that trend-followers do not make high returns trading rising rate environments. Generally, that view has been true for several reasons. 

One, the trend in rates has been down since the early 1980's, consistent with the decline inflation and real rates. Two, rising rate periods have not lasted long and have generally been linked with higher volatility. The opportunity for short Treasury trades have been fewer. Three, central banks have shown a bias toward capping rate increases, the Greenspan put. Four, central banks have been involved with QE since 2008 which pushed rates lower. Money was made with shorting bond futures, but it was not easy profits and the rising rate trends were not as extended as the rate declines even with a zero bound. Four, during the period of rising rate in the 1970's, bond futures were not actively used. We don't have good information on how the trend-followers would have done. There can be assessments based on rate data, but not futures. 

The world has changed over the last year with the Fed raising rates with a consistent change in policy. Trend-following is conditional on the global macro environment. We are now in a Fed hawkish environment with repeated increases in rates. The result has been an extended trend higher in rates and trend-followers making money from the short side. This Fed change does not mean one-sided trading but there is a tilt to rate increases with short-term reversal; the opposite of pre-pandemic decades where the tilt was to lower rates with intermittent rate increases.   

Sahm Rule recession indicator - Not at critical level but trend is higher


The Sahm Rule is a good recession indicator based on the simple calculation of the three-month moving average of the national unemployment rate U3 by .5 percent or more over the low of the last 12 months. Clearly, if the unemployment rate is falling, no recession. If the unemployment rate is rising relative a past low, it can be a signal for a recession. The number can get fairly high with the peak reaching at the end of the recession. The graph does not do justice to the key threshold of .5; nevertheless, the Sahm Rule will give a strong indication of a recession. This may not be a true early warning, but it provides a clear lowdown signal. The FRED database provides a real-time and adjusted Sahm Rule where the adjusted value accounts for revisions.

If we look at the last year, the indicator has moved from negative to positive and is showing a strong trend, yet it is not near the key .5 level. The trend directional change is correlated well with the market top. 


Tuesday, November 8, 2022

Economic trade projects diplomatic power


Economic power projects diplomatic power. Trading partners will listen to each other. This is both a reality and necessity; however, the influence may be one-sided.

Economic powers will project their values, political system, and culture. It may not happen immediately; however, cultural and political hegemony will march with economic trade. 

The switch in trading hierarchies from the US to China is astounding and consistent with the strong growth in China and its need for resources. The China effect is driven by extraction from emerging markets and the sale of goods to developed markets. This process is still relatively young so the credit, banking, and currency implications have still not matched the trade relationships. 

Given the current struggles between the US and China, the exertion of power on trading partners will grow. China may not look for active but silent partners who will not interfere with their politics. The US will look for friends to shore its trade, but it is less dominant around the world. All this will play-out in debt and equity markets as EM firms may have to side with their economic interests. We have already seen some of these trade politics play through the oil markets. 

Sunday, November 6, 2022

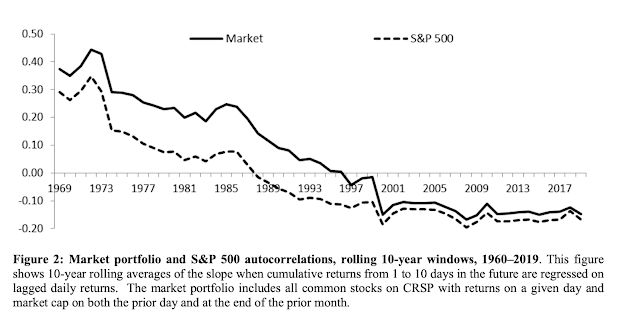
Autocorrelation of stocks and bonds - why is it hard to trend-follow with stocks


It is very simple rule. It is hard to make money using a trend-following model if there is no positive autocorrelation in returns. It is even more difficult if the asset shows negative autocorrelation. A recent paper looks at 60 years of data to measure the autocorrelation of individual stocks, equity portfolios, and bonds. See "Autocorrelation of stock and bond returns, 1960–2019".

Beyond the implications for trend-following, this work shows that the autocorrelation for stocks and bonds changes through time. For individual stocks, the autocorrelations are always negative, but there is significant ebb and flows in the size of this time series effect. For equity portfolios, the autocorrelations have moved from positive to negative. For bonds, the author finds that autocorrelations have moved from strongly positive to negative like stock portfolios. The paper presents autocorrelation data on portfolios and stocks conditional on factors such as volatility, turnover, and size. 

It finds that smaller cap stocks show more negative autocorrelation across all time periods while large caps are closer to random. Lower turnover stocks show more negative autocorrelation. High volatility stocks show more negative autocorrelation.

Small stock portfolios have more positive autocorrelation. Low turnover and low volatility portfolios have more negative autocorrelation.

Any investor has to fight the natural time series behavior of stocks which is to reverse the direction and show negative autocorrelation. Investors should use this tendency to their advantage.


Trend-followers are not alike - The case of turbulence


The concept of turbulence has been well-developed by Kritzman and Turkington using a distance function. You want to look at the joint behavior across assets in manner that accounts for both volatility and correlation. From this distance function we can measure the correlation surprise, the impact of changes in the correlation across assets as well as shocks to volatility. The use of distance functions provides simple means of accounting for both volatility and correlation in a single measure of disruption. 

Using the turbulence distance function, events can be decomposed into magnitude or correlation blind measures when the off-diagonals are set to zero and correlation surprises which is the ratio of turbulence versus magnitude measures, or volatility shocks and correlation shocks from the turbulence measure.

The turbulence function has been recently used in a paper to measure disruption across a set of large trend-followers. Periods of high turbulence across managers can be matched with market events to determine when diversification across managers is most needed. See "Quantifying Turbulence in Trend-following"

The results suggest that turbulence shocks are associated with specific market events. Some of these events raise volatility across all managers, magnitude shocks while others will be associated with correlation shocks which are likely associated with differences in portfolio compositions across managers. Investors need to be aware of these shocks to build better portfolios. High turbulence will in general show low returns.


Trending the trendfollowers - Can it be done?


Can you trend-follow the trend-follower? This is an important question give the strong performance of trend-followers in the last year. Put another way, is it too late to allocate to the trend manager? Should you wait for the next trend drawdown? 

We don't have a solid answer but would like to present some ideas for consideration. 

1.    Asset return behavior is different from strategy return behavior. Asset prices can go through long rising or falling periods and there can be an assessment of fair valuer for an asset which will impact trend behavior. Trend-following as a strategy does not have a fair value and positions can change quickly across many markets, so asset and strategy behavior cannot be compared.

2.    Trend-following attempts to exploit any autocorrelation within the assets it trades. If this is done effectively, there is will little autocorrelation in the strategy itself. See "Can you trend follow trend-following?"

3.    Trend-following is regime dependent with returns often clustered for short-periods. Some call this the crisis alpha effect. Unfortunately, it is hard to determine when there will be a crisis and when a give crisis will end. 

4.    Diversification across asset classes makes it harder to determine which assets will be the driver of return. 

5.    Trends will often last longer than expected. Hence, it cannot be said that trend performance will reverse.  However, there are long-term Sharpe ratios that can be a guide for performance.

6.    A trend that ends can just mean a reversal in a position from long to short. The risk is the difference between the maximum profit and the time until the position is reversed.

7.    Buying into drawdowns is not based on mean reversion given positions can be long or short. There is no mean reversion based on the assets bought. A drawdown could mean that old positions have been cleared within the strategy. A drawdown may also be associated with deleveraging which reduces return potential. Mean reversion during a drawdown is based on skill assessment or whether the manager just faced bad luck during a drawdown.

8.     Trend-following is impacted by volatility - both the level and change. Higher volatility is good but changes in volatility can hurt performance.

The timing trend-following is not easy and should be done with care; nevertheless, investor should account for the market regime and the current Sharpe ratio versus the long-term Sharpe of the manager and the overall strategy. The Sharpe ratios will mean-revert.


Saturday, November 5, 2022

Polycrises - multiple crises are a reality


Policymakers and investors have increased their awareness of systemic risks and crisis events. Policymakers have developed macro prudential policies to limit the impact of systemic risks. Investors have spent focused time and effort on tail risks and how to mitigate large losses from a market crisis. However, most of the focus has been on a single crisis or shock. Less time has been spent on thinking through the impact of multiple events that can all cause harms.  If crises occur at the same time, a small crisis may turn into a catastrophic event. These correlated events would be a polycrisis. See "What Is a Global Polycrisis? And how is it different from a systemic risk?"


From the Cascade Institute - "A global polycrisis occurs when crises in multiple global systems become causally entangled in ways that significantly degrade humanity’s prospects. These interacting crises produce harms greater than the sum of those the crises would produce in isolation, were their host systems not so deeply interconnected."
So, what is the possible polycrisis we are currently facing? Let's just list some of the intersecting issues: Ukraine-Russia War, the pandemic residuals, the China-Taiwan-US situation, the deglobalization issue, the climate crisis, the inflation crisis, the excess money and debt crises, a commodity crisis, and an overvalued stock and bond market. 

We will do walk through all these issues other than to say that the solution of one may conflict with another. Current energy security conflicts with climate change. The geopolitical issues conflict with inflation. The inflation problem conflicts with an overvalued market problem. All these crises are interconnected and complex. Policymakers will not be able to solve all. Solving one may make others worse. Each may change in importance over time, so it is difficult to forecast market behavior. A polycrisis adds to complexity and uncertainty. We live in a VUCA (Volatility, Uncertainty, Complexity and Ambiguity) world.    


Thursday, November 3, 2022

Survivorship bias - Need to know what is missing from the data


There is the old story concerning Abraham Wald, the great statistician, and measuring the right thing in any statistics problem. The Air Force in WWII wanted to determine how they should add armor to their bombers to ensure they would survive given heavy losses from its daylight bombing. The air force staff gathered statistics on all the bombers that came back after missions and looked at the probability of certain areas of the plane being hit with flak or bullets. The idea was to add armor to those areas most often hit with enemy flak.

They proudly gave their extensive evidence to Professor Wald and asked him to validate their thinking on where to put the most armor. He responded in a very simple way by saying that armor should be placed where there was no record of damage. This was just the opposite of what was expected by the other statisticians. His answer was simple and profound, "The bombers hit in those places never came back." The data analysts could count the surviving bombers' damage. There is no evidence for the bombers that crashed.

Ask what data are counting and then ask what the data are not counting. Only survivors are counted and included in databases. You also want to know what got away from the analysis.