Thursday, February 27, 2020

What if you could not forget any information - would you be a better investor?


What if you had the ability to never forget? You could remember everything that happened to you and everything you have read. You have total recall of all news and investment events. Would you be the world's greatest investor? 

There have often been tales of unique people with true outlier skills or abnormalities, these case studies can often be used to help us understand the complexities of our mind. By isolating extremes, we have a better idea of how the mind functions as an integrated system. 

There have been cases of people who had varying degrees of perfect memory, but for this post, I would like to play a thought experiment for the case of the perfect memory investor. Assume you had the same analytic skills, but you had the memory of a computer and can pull information forward to use in any assessment. Would you be a better investor?

I asked a few people who are not investors whether they would like the skill of perfect memory. Surprisingly, the view of my small sample was that this would not be good. Their biggest concern is that bad memories would outweigh good memories and cause more sadness than happiness. Most people block the negative and focus on the positive, yet for investors, there is a focus on risk management which requires memories of negative events.

There was also a question of short-term and long-term memories. Some expressed the view that they did not want to remember the distant past and thought there was the potential for too much information clutter. There was a preference for having better memory about more current events. There was also a concern that more memory would make it harder to process all the information.

In some sense, the data scientist always is always fighting to add more data, but is there the possibility of too much? Is there a point of data saturation or a tipping point where there is too much information? 

Underlying the memory question is your ability to bundle data, find connections, see correlations, condense data. Memory without processing power may be a hinderance. Forget data and events and improve processing may be a more important trade-off. We can go back to the analogy used to explain super-forecasters. It may be better to be a fox over a hedgehog. Finding connections may trump facts and memory.

Wednesday, February 26, 2020

Recency bias - It is not solved by being quant


The recency bias states that we more easily remember or recall events which have occurred more recently than those in the past. Thinking about this bias leads to a deeper discussion on how far back in time should your memory go. Or, how much memory do you need to avoid this recency bias? 

This is especially important when considering investment decisions. How far back in time should you look for answers of diversification and return prediction? What are recent and what are distant memories and does recency bias change based on the problem to be addressed? 

The power of any recency bias is not avoided just because you use quantitative models. In fact, recency issues may be worse with data driven strategies because decisions are solely based on sample sizes that may be limited. In the general case of using use mean and standard deviation of return, all sample data is equal but there is a bias based on the sample chosen. By definition, using a given sample states that you have no memory after the initial data sample used. The look-back period is critical with accepting or rejecting a specific strategy. For example, a look-back of five years has a recency bias for the last five years. Events beyond five years have no relevance for the analysis.

More data is generally better than less data; nevertheless, inference using daily data for five years may be acceptable for some decisions. However, if we are making a strategic allocation decision, there is a recency bias even if you look over just a single business cycle. In the asset allocation decision, there may be a need for decades of data if it is available. At the other extreme, there can be data saturation if too much information is used, and the economic environment has changed. 

Any recency bias is decision relative. An "unbiased" sample for one decision is very biased for another. Being quantitative does not change the fact we can be data biased. Appreciating a flexible definition of recency bias is useful. 

Monday, February 24, 2020

Blending trend-following and carry through simple diagrams


The value and cost of trend-following can be shown through a simple set of diagrams. The value is convexity. The cost is associated with the periods of poor or no trends. The costs can be offset through employing carry strategies that are concave. An investor can trade-off between concave and convex strategies to find the right pay-off function.

Saturday, February 22, 2020

Mean reversion in style factors - Don't go chasing returns


"Don't chase those returns." "Follow what is best." There is aways contradictory advice with investments because returns are time varying and usually mean-revert. This applies to style factors as well as traditional betas. 

A simple analysis from MFS analyst Noah Rumpf in his study "Value, Momentum and Mean Reversion in Factor Returns" provides some useful insights on mean-reversion and style factors. Using the Fama-French database of 13 different style factors, Rumpf finds strong mean reversion. He uses a  simple sort of choosing the best factors and then looks at the forward performance.

If you pick a portfolio of the best four factor returns over the last 10-years, it will be the worst performing portfolio over the next year. The worst four factors will outperform the best over the next year. The classic idea of tracking returns and finding the best past performance will only result in financial heartache. Choosing the worst will have a better chance for success. 

The simplest solution to the mean reversion problem is to choose a diversified portfolio of good and bad factors. The bad ones are likely to be the least correlated with the good factors. Think about the environment and not the past performance. 

Friday, February 21, 2020

Primacy and recency effects - The ordering of ideas matters


If I give you a list of five important investment ideas, you will likely remember the first and the last, and forget the ideas in the middle. Exploiting the primacy and recency effect is used with almost all marketing and screen development. What we look at first and last matters.  

This knowledge can be used with investment decision-making especially given there is so much data to review in any given day. This seems obvious, but the critical issue is to ensure recall. The development of investment dashboards has grown as managers have tried to condense information on a screen. The primacy effect says to focus on what is most important to the top of the dashboard. Similarly, recency tells us to also place important information at the end of a report. 

Similarly, all marketing and research material should exploit these recall effects. What is said in the middle does not matter because the audience will not remember your point. Obviously, we have always had a bias to quantitative modeling because there will be no primacy and recency effects, but at some point even output will have to be reviewed, so ordering output will matter.  

Thursday, February 20, 2020

Financial Repression - Still a growing issue around the world


It is critical to know the financial environment we are navigating. Currently, we are in a world of financial repression through policies that hurt savers, encourage speculation, and hampers growth. This has been going on for approximately a decade. It is strong language but it is an apt framework for thinking about investment decisions and portfolio construction. We have written on this theme in the past, but it critical to understand this regime.

Financial repression is the use of government regulatory or monetary policy to capture or under-pay domestic savers in an attempt to strengthen growth, meet policy objectives like cutting the cost of debt, or funneling funds to specific projects. The phrase by Ronald McKinnon was first used to describe the policy actions of emerging markets, but it now represents the objective of many advanced economies.
  • Maintain low rates and/or negative real rates to cut the cost of debt; the whole QE policy focus.
  • Use "macro-prudential" policies to limit growth and control banking, finance, and insurance industries.
  • Develop debtor friendly policies relative to creditors/savers to reduce the burden on borrowers.
  • Develop policies that limit flow or control capital to reduce the impact domestic debtors.

All of these policies may be classified as financial repression. Some may serve useful short-term goals, but they all serve as a form of hidden taxation on savers. Inflation, regulation, forced negative rates, and capital controls are saving taxes that attempt to repurpose capital. If temporary policies turn more permanent, there will be significant distortions as savers attempt to avoid the repression.

The response of markets is predictable. Savers engage in riskier investments to offset the repression, the search or reach for yield. The low real rates support marginal firms, industrial and financial zombies that should not exist. Those firms that can borrow will borrow and allow for equity buy-backs over demand driven investments. Unfortunately, these repression regimes can last for decades because the reversals of economic distortions are  painful. 

A transition away from financial repression is not a burst of financial freedom that will be good for markets but a potentially violent upheaval as market adjust to "normalcy". Call it the big tail event, but financial repression is not easy to eradicate. Still, it is critical to think through a portfolio barbell of holding real assets and prepare for a tail contingency. 

 See Financial Repression is Here - Helicopter Money and MMT Coming 

Tuesday, February 18, 2020

Instrumental and epistemic rationality - worth thinking deeper about decision behavior and intelligence


Rationality has been defined as either being instrumental and epistemic. See the work of Keith Stanovich, the cognitive scientist focused on the psychology of reasoning and others for more details. Given this construct, it is relevant to think about the different forms of rationality to help explain why investors make good and bad decisions. Investor may act rational in that they are trying to meet their goals. The problem is their belief system may be wrong.

Rationality is not the same as intelligence, so someone who is intelligent may not always act rational. Similarly, if there is a range of intelligence, we should also expect a range of rationality.  It is not just a yes-no issue.

Instrumental rationality, according to Stanovich, means behaving in the world so that you get exactly what you most want, given the resources (physical and mental) available to you. You are and act like an optimizer for your goals. 


However, there is another form of rationality. Epistemic rationality is concerned with how well beliefs map onto the actual structure of the world. 


This is often referred to as theoretical or evidential rationality. This is where there is more potential for irrationality. You are wrong or irrational because your beliefs do not match with reality. There is rationality in your implementation, but it can be based on wrong beliefs or belief updating. If you are epistemic rational, you will be skeptical of unfounded beliefs and change beliefs as new evidence is presented.

This combination is the rationality that we often talk about as economists in an expected utility framework. It is process driven can be described through the axioms of choice. If we follow those axioms, then we are behaving rationally. If we act to fulfill our goals, we are rational regardless of the view of others. Given the axioms of choice, it relatively easy to measure whether someone is acting rational or committing errors, just check for violations of consistency. However, these behavioral tests do not measure intelligence, and do not tell us much about rationality of the individual


Rationality can be consistent with wrong beliefs. There can be optimization of beliefs that are wrong or have the wrong likelihoods. Someone can follow the axioms of choice but make bad decisions on beliefs. This closer breakdown of rationality does not dismiss biases and errors in decision-making. Rather, these differences in rationality require us to look deeper on why mistakes are made. 

There can be degrees of rationality like degrees of intelligence. You are on both an intelligence and rational spectrum. The rational person blends the reflective mind of beliefs and goals with algorithmic mind that processes information. To truly understand the behavioral finance revolution requires not just an understanding of decision errors but the forms of rationality and why they may change. Picking the right portfolio manager is looking at the blend of rationality and intelligence. 

The power of credit hedge funds - Good underlying returns


Credit hedge funds have provided better return to risk profiles than macro, equity, and multi-strategy hedge funds for both the last twenty years and the last decade as measured by the researchers at Barclays. It can be argued that there are more inefficiencies in credit markets versus equity markets and this has allowed active investors to generate strong risk-adjusted gains. The strategies used by credit funds are often similar to what are used in other asset classes; value, quality, carry, and volatility, so the focus has to be on factor dispersion that translates to higher returns.

The ability of these funds to capture returns and information ratios relative to a benchmark is high. The capture ratios are similar to or better than what is found for equity hedge funds. Credit hedge funds have benefited from falling rates and a good economic cycle, but performance has been good on relative basis.

The majority of bond buyers may be driven by motives different from hedge fund profit maximizers who are only interested in total return. This may allow credit hedge funds to product strong returns. This also suggests that the performance gain may fall with added players in the market; nevertheless, the effective gains suggest a close look at these alternatives. 

Sunday, February 16, 2020

The same benefits that exist for equity ARP apply to credit ARP

The same benefits of investing in style factors for equities also applies to credit investing. This should not be surprising given the link between the value of debt and the firm. As measured by MSCI indices, a breakdown of styles for rates with risk measured by duration shows quality, size, volatility, value, and carry all provide either higher return, lower risk, or an increase in return to risk. These benefits exist even after accounting for transaction costs.


However, like style factors for other asset classes, the return behavior is time-varying and moves with business cycle changes. The information ratio variation across the business cycle changes with style. Quality, for example, does poorly during a recovery, but carry will do well. Similarly, value will do well during a recovery, but a low risk strategy will underperform. 

It is clear that a multi-strategy approach that blends style factors will improve return with only a slight increase in risk. Credit investing can be improved through looking at style factors. This increases credit opportunities for investors even in a low interest rate environment.  

Saturday, February 15, 2020

Black Swan, uncertainty, contagion, and the coronavirus


The coronavirus is a Black Swan event coupled with growing uncertainty from misinformation, and actual global economic contagion that is turning into perfect storm shock. This rare event is having an impact across markets that will continue to gain steam and cannot be offset by monetary or fiscal policy.  

  • A black swan - an unanticipated rare event with extreme consequences that cannot be handicapped by objective probabilities.
  • Uncertainty - an event that is not easily measured with objective probabilities.
  • Contagion - an event that can have spillover effects across markets and regions.
We do not know what we are dealing with. There is limited history on how to fight or control this virus. This epidemic has the potential to turn into a pandemic.
  • The measurement of this epidemic is unclear with information that is limited or actually misleading.
  • Information is being withheld which may provide insight on the extent of the problem. Governments may be misleading in order to protect people from the truth.
  • The response to the virus by people and governments is large and not always driven by science. This increases the chance for panic.
  • The economic reaction is far-reaching in commodities, production, transportation, and supply chains making this a global problem.
  • The economic impact from this virus is increasing and the growth shock may not be able offset by more monetary liquidity.
While US equity markets have been reacting new highs, the shock to other markets like energy and commodities is large. This shock requires forward-thinking that suggests a more cautious response focused on principal protection. The heuristic of one good reason decision-making states that conservative positions should be taken.

Friday, February 14, 2020

The low volatility style factor - A great history, but can it continue?


Low volatility has been the darling of the style factor investment world and for good reason. Who doesn't want lower risk and higher returns? It has been a free lunch that should not exist. Low volatility factor strategies have consistently had higher information ratios than a corresponding benchmark index. The return to risk advantage exists across geography and styles. Reduce risk and gain return through a focus on low volatility.

The strategy is simple with a sorting of risk across a universe of stocks and buying the low volatility names. It is not a minimum volatility strategy which is formed differently. A classic finance view would say that lower risk means lower return, but what has been found is that return to risk for this style factor is relatively high and persistent. 


Using low volatility is a simple asset allocation solution to providing some downside protection without high costs. The upside and downside capture analysis of low volatility indices shows that it captures about 70-80 percent of the upside for benchmark gains, but sees only a portion of the downside losses; less than 50 percent for down months. Lose less in down markets and capture more in up markets generates positive gains versus a benchmark. 

The question is whether this style can persist, or in the modern jargon, is this a crowded trade? The historical data says that it can. There are periods when both the market and rates rise which are not low volatility favorable, but generally, this factor shows consistency. There has been analysis that shows low volatility stocks are looking expensive, but the low volatility signals have existed for a few years. Even with the greater focus on this strategy, it is worth a closer investigation. 

Low volatility stocks have been and continue to be expensive; however, when compared against the market as a whole, the richness is not extraordinary versus the market in general. Clearly, the risk to all equities is higher and low volatility is sensitive to rising rates, but there is room for switching to low volatility exposures as a way of taking risk off the table while still participating in the equity markey moves.

Tuesday, February 11, 2020

Realize that every benchmark or index is a bundle of factors


Index companies have gotten good at developing factor indices to stand alongside their core benchmark products. STOXX has recently created a set of factor indices that increase the set of choices for investors. STOXX has also launched with Qontingo (using the Axioma factor risk model), a tool for index factor analysis (factor iQ). See STOXX.com.

Below are the factor breakdowns for the STOXX Global 1800 Value index and the STOXX Global 1800 Momentum index with the factor exposures versus the STOXX Global 1800 index benchmark. Both have high factor exposures associated with their name. In the case of the value index, there are high exposures for B/P and earnings yield, and for the momentum index, there is a high exposure to the momentum factor.


However, there are also exposures to other factors such as liquidity, dividend yield, and market sensitivity for value and liquidity and growth for momentum. There is no such thing as a pure factor exposure. There can be steps in construction to limit exposure to other factors but there will be some mix of other stuff. Investors should be aware of other factors that influence their expected factor exposures. 

Monday, February 10, 2020

Factor indices can add value and change equity risk profile


The STOXX indexing firm launched a set of factor indices that show the value of holding selected factor risk exposures. In all cases around the globe, there is a return to risk benefit from holding a low volatility index. There are varying degrees of return to risk benefit from other style factors. Generally, there is always higher return for holding the factor index. A blend of factors will improve return with about the same amount of risk as the benchmark. Placing some factor tilts in a portfolio will benefit investors as measured by past history.

The performance of different factors differs by geographical regions. Holding value in the US is not the same as holding value in Asia and Europe. Equity style factors have a mixed set of correlations, so there is a diversification benefit from holding different factor exposures.


Nonetheless, there are no guarantees that these style factor premiums will always perform well. For example, the value factor has been underperforming especially in Europe, and there is a wide difference in momentum performance between Europe and Asia (APAC). Low risk has done poorly in the US but  has shown better returns in poorer performing Europe. There is a wide gap between Asia quality and the rest of the world. However, blending into a multi-factor index will have good smooth returns.    


Index providers are all generating factor indices which makes it easier to measure and track factor effects. What the historic record shows is that there are wide differences between style factors and regional performance that requires a closer look before any factor investing decision is made. Still, holding factor tilts may be an effective way at changing the equity exposure in a portfolio.

Sunday, February 9, 2020

An alternative investment matrix - Determine weights for each box


Defining the alternative investment universe is actually not easy.  It is more than just hedge funds. There is a spectrum of different choices for investors and there is often confusion on what choice is best for a given objective or environment. However, an alternative matrix that uses a grid on two dimensions, income/volatility versus asset characteristics (fixed income/equities) can be a help. Given this matrix approach, first developed by JP Morgan, investors will choose core, complements, or return enhancers. 

Investors need to think about the choice of asset characteristics, fixed income or equities and volatility. Do you want more carry or total return? Do you want more or less risk? Investors can develop a core satellite approach for alternatives.

This can also be viewed as a pyramid of choices with traditional assets on the bottom as a core. Upon the core will be a set of similar alternatives. In the case of fixed income, it could be core private credit. In the case of equities, it could be smart beta or style specific beta choices. The next level will include hedge funds which should be able to provide added diversification to the core portfolio. Upon the top of the pyramid will be alternative choices that will be situational, have higher risk, and the opportunity for higher returns. Each box or level will have its own return and risk characteristics. Investors will have to look at the trade-off of moving from one box or level to another.

How the alternative investment matrix can be used can be based on where we are in the business cycle, what is an investor's tolerance for risk, liquidity needs, and current valuation. For example, being late in the business cycle may require a move from illiquid to more liquid alternatives and a move away from things like distressed credit.

Fixed income factor analysis - Interesting breakdown for high yield


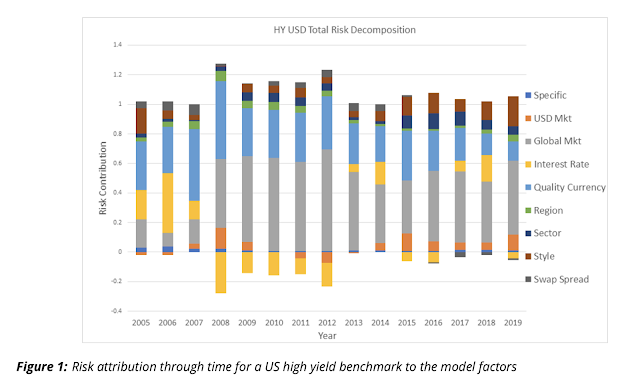
Axioma has a new factor-based risk decomposition that may surprise investors. The conventional view is that high yield returns can be broken into two factors an interest rate component associated with Treasury moves and a spread component that will be related to corporate risk. The corporate risk will be related to a number of factors like the market beta and industry-specific factors.

The Axioma factor-based model uses cross-sectional regression on thousands of issuer duration adjusted spread returns to account for global and regional factors, as well as currency, quality, sector, and style factors.  

The more detailed analysis provides a more nuanced view of the changing risks with corporate bonds. For example, the risk contribution from interest rates can flip between positive and negative. Global markets were a small contributor to risk in the pre-crisis period but has dominated the high yield market since 2008.

The decomposition shows that global market risk is still the key driver of risk and seems like a good proxy for spreads. In some sense, high yield spreads are just a different proxy for market risk. The risk decomposition does identify a more complex set risks which may not be obvious to investors. The idea that holding credit as an alternative to market risk should be reviewed carefully.

Saturday, February 8, 2020

Rare events, force majeure, and coronavirus


The impact of the coronavirus on the global economy may be deeper than thought. New reports are showing that commodity market may be affected as some buyers are invoking force majeure contract provisions to get out of obligations for delivery. In this case, the coronavirus is being viewed as an "act of God" and is covered by this contract feature. A force majeure provision should be specific but exists to cover rare events that will have high economic impact, a tail event. These events can subjective because the contract may cover events that have never occurred and a poorer economic environment my itself may not be a force majeure event.

A Chinese natural gas (LNG) buyer and copper importer have invoked this clause and will not take delivery of commodities. There are reports that close to 50 LNG cargoes may be affected. There are also reports of a desire by some commodity importers to slow deliveries. 

The actions of one may actually lead to run on the bank problem as others start to invoke the force majeure provision. This will cause global logistic problems and create a greater likelihood of steeper commodity market contango. 

The supply chain is the front-line of any economic slowdown and the most likely place to see the impact of a demand shock. Financial markets have reacted to the virus, but the there is a discounting of longer-term cash flows. Reneging of commodity contracts places supply directly into markets.  Coupled with a warm winter, natural gas has been in a deep fall since November. Copper prices have been hit with a virus effect because the quarantines have led to a clear economic slowdown.

Can force majeure be priced? The problem is that both parties may have subjective expectations which cannot be quantified, but it has value since parties will require this language provision. There is clear optionality with a provision that allows a party to walk away from the contract and as the economic environment has increased in uncertainty and volatility has moved higher, the value of this provision has increased. 

Contract provisions that have been given little thought may actually create a feedback loop that will spillover to global markets. Further weakening in commodity market will also affect credit markets and firm viability for mining and energy firms. The coronavirus is contagious in ways that are often unexpected.

Friday, February 7, 2020

Palladium price shock - A case study for why commodities are different


Palladium prices have exploded on the upside with a gain of almost 25 percent since December and over 60 percent in the last year. This is in contrast to gold, silver, and platinum which have had strong gains but nowhere near the price change for palladium. Palladium is a case study on why commodities are different than other financial assets and may have explosive gains and loses with greater likelihood.

Supply and demand shocks can create large price moves because new commodity production cannot be generated in the short-run nor can substitutes be found to satiate demand. In contrast to financial assets, there is no new supply through issuing stocks or cutting supply through buybacks. There is no inelastic demand because there often can be found close substitutes with similar return and risk. 
  
Demand for many commodities can be very inelastic because there are limited substitutes. Palladium is a necessary metal in catalytic converters especially for gasoline engines and the next closest substitute, platinum, is less efficient. 85 percent of palladium usage is tied to the automotive industry, so high auto production with more stringent pollution standards will keep demand high. 

Supply is also inelastic given the costs of developing new mines and the fact that there are often decreasing returns to scale with mining. In the case of palladium, it is a by-product metal from nickel and gold mining. New mining is a function of the average or combined cost of the metals to be found. Palladium has been in net deficit for a number of years and the inventory buffer stock has been eroded.


This does not mean speculative bubbles cannot exist in commodity markets. Since it is hard to determine the actual supply necessary to meet demand and small transactions can move the market, there is the potential for excessive feedback loops. In fact, there may be more potential for extreme expectations in these smaller markets. Of course, the old commodity adage is that the solution to high prices is a high price. In those case, substitutes and new supplies will be found. We are now seeing thieves stealing catalytic converters.

When inelastic demand meets inelastic supply, the result is high volatility and the potential for big price moves from any supply or demand dislocation. This is one of the key reasons why these markets are often liked by trend-followers. Given that supply and demand shocks may play-out through time, there may slow change in price. Trends will last longer than expected.

Wednesday, February 5, 2020

The "last mile" problem and investment management


The last mile problem traditionally has referred to the telecommunication issue of connecting to the final customer, or in supply chains, the final delivery of the goods. It is the most expensive, the most labor intensive, and the most complex part of any business at getting right. Every firm wants to solve the cost and implementation issues of the last mile.

The "last mile" problem for an asset management firm or hedge fund is the connection between research ideas and research implementation. There are transaction and systems cost with implemented research ideas that are not trivial. Research ideas are plentiful but good implementation skills are scarce.

Reading all of the quant research on portfolio construction, I am always impressed by the elegance of the math and the ingenuity of the ideas, but I find limited implementation. Some of this is lack of implementation is a function of education. The  connection between the research idea and customer understanding and appreciation is not easy to solve. Client education is expensive and the value of better research is often not apparent in a normal market environment; however, cost is another driver for why ideas are not used.  

Ideas implementation is limited because the costs of thelast mile problem rears its ugly head as a core asset management problem. Converting research to a workable plan is not easy and requires a tremendous coordination between research, trading, accounting, and portfolio management. Many ideas require more transactions, the sourcing of liquidity, strong accounting (performance contribution and attribution), and skilled management. 

The cost of idea generation is often lower than the cost of implementation. Transaction costs often trump a good theory. Hence, it is critical to define and measure the cost implementation for a strategy. 

Simplicity beats complexity, so there is value with taking complex math and breaking it down to the core value-added. A management standard should be to test research complexity versus management simplicity.

Does this mean investors should fore go new research? No. The  focus has to be on the translation of research into action. When it is done right, management fees are earned and value is created.

Tuesday, February 4, 2020

ECB historical policy review - An institution in two regimes


Happy 20th birthday the EMU and the ECB. Not clear whether we should treat this birthday as a celebration. It has gone through significant growing pains and a large personality change. An institutional review is presented in the ECB working paper, "A tale of two decades: the ECB's monetary policy at 20". This is a long piece, over 300 pages, and may be a little biased given it is an ECB working paper, but it lays-out the significant changes in the thinking and policy responses of the central bank.

It will pay for all investors to think about the ECB as being two different institutions or having shifted personalities. In the first decade it acted like a traditional central bank with a 2% inflation ceiling, (not a target). A second shorter period is when it moved to be an activist disinflation fighter. This is not the central bank first envisioned, but it is the central that the EMU has now. 


The question going forward is whether the second decade tale will continue or whether ECB President Lagarde will find a new third decade path. The activist ECB is the current bias, but it is not a long-term monetary strategy but an increasingly complex set of policies to find a solution to a problem that does not seem to go away. 

Investors will be hard pressed to make strong decisions without a clear policy direction and a mandate for what the ECB wants to achieve. This institution needs a clarifying strategy.   

Monday, February 3, 2020

Keep decisions simple when there is uncertainty - The case of coronavirus


"So, in general, if you are in an uncertain world, make it simple. If you are in a world that’s highly predictable, make it complex."

Gerd Gigerenzer "Instinct Can Beat Analytical Thinking"

The challenge for decision-making and model building is determining whether you are in an uncertain world or a predictable work. Or, as Robin Hogarth has referred to as "kind" or "wicked" learning environments. (See "Kind" versus "Wicked" learning environment - Financial markets are not kind) In a wicked model, the link between between the past and future is unclear or uncertain. It is hard to learn and model in this situation. Your modeling and decision response should be based on the environment you face.

I have investing years trying to think through the problem of using heuristics versus analytics and avoiding behavioral biases and focusing on quantitative rationality. Someone who has not grappled with this issue has avoided the crux of making good decisions under uncertainty. There is a form of comfort with being a model builder. You can avoid the challenges of uncertainty by attempting to increase complexity. There is also comfort with having heuristics because they are fast and simple to implement. Moving between these two extremes may separate the average from the very good investor.

I bring this issue to the forefront because the current focus on the coronavirus is a real world case of dealing with high uncertainty. No one could spell or even cared about this issue a few weeks ago, but now it is driving the financial markets. Someone can derive models for infection rates and shocks to different economies from a potential pandemic. This is rational and makes sense, but this may be a better time for using good heuristics like "one good reason decision-making". 

The one good reason heuristic is simple. There is an unknown risk that can have a large financial impact and is causing prices to fall now; therefore, sell risk exposure and get to the sidelines. There is no big complex model, the trend is down, get out. The risks are not easily measurable and growing, get out. This is a good reason and don't wait for a deeper model answer. As new information is added, the decision can change, but the quick answer may be the best when the inputs for modeling are unclear.   


Sunday, February 2, 2020

AQR expected returns - Don't expect much return

Long-term asset return forecasts help temper changes in asset allocation and portfolio return expectations. After a strong return year, there is often return extrapolation. This extrapolation is not usually one for one, but a good year will give investors the view that it will continue into the next year; however, a close look at long-term expectations suggests that 2019 returns are unlikely to be repeated.

The AQR 5-10-year expected returns show a decline over all asset classes from the prior year. For equities, the higher valuations point to lower future returns. For bonds, lower current yields, the best indicator of future returns, point to lower fixed income returns. Inflation expectations may be lower, but real yields are not expected to receive a boost. Credit spreads are tight and will not provide significant return gains for investors. Long-term average returns for commodities will stay low without the threat of a supply shock.

Traditional assets in any simple asset allocation will not generate real returns even near 4%. The only way to gain higher returns is through alternative investment which will subject investors to liquidity issues or different risk premia. The challenge is to find the alternatives that can produce higher real portfolio returns while adding diversification. It can be done, but it requires active decisions and greater monitoring.  

Saturday, February 1, 2020

Sahm recession indicator - Nothing to see here now


Quantitative indices should provide a lot of information in a simple form that is easy to read. The Sahm Indicator or rule seems to present a nice picture on an economic slowdown that is easy to create and has gotten a lot of recent interest. It is just the 3-month moving average of unemployment minus the low of the last 12 months. If the number moves above .5, there is the expectation that there will a recession. 

It was created by a former Fed economist to look for times when fiscal stimulus may be necessary; however, the question is whether this is a better than simple picture and whether this indicator has predictive power. It is pre-calculated in the St Louis FRED database. Of course, the standard of whether it can predict a recession based NBER dating is a fool's errand since the NBER dating comes well after a recession begins. 

The Sahm Indicator can be compared with the 3-month moving average to show how translation of data can have a significant impact on visualization.

Looking at a difference can rough up the data at key points. A spike is very clear that labor markets are hitting a rough patch. Hat tip to Klement on Investing as to whether this has predictive power. It is not predictive as measured by classic NBER dating, but investors have to think in terms of a nowcast. 

Labor markets are hard to employ as a leading indicator. Nevertheless, recasting data can be a form of private information that can be exploited, so data transformation should be a regular tool used by any global macro quant analyst.