Saturday, January 31, 2015

Treasury note volatility VXTYN - there is a lot going on

The CBOE has been trying to develop a Treasury note volatility index to complement the VIX index. This contract market could be a good addition to the mix of exchange traded products although the chance of success is relatively low. Most futures contracts fail even if there is a good economic rational for its existence.There is no volume trading on the futures but that does not mean that the index is not useful for research. 

There are two indices that use the same methodology in two different asset classes which we can use to tell us something about relative risk. The chart above from the CBOE covers the financial and post-crisis period. Most investors would be surprised by the size of the extreme moves in bonds relative to stocks. Treasuries are risky. Bonds are not always a safe asset. The volatility could be over than stocks but the change in volatility is very large. The swings in risk and uncertainty are large and when  bond volatility moves, stock volatility may not see the same type of changes.


The first chart above shows the VXTYN index over the last year. It has been a clear uptrend with an increase of 26% for the year. There were three large spikes in the last four months starting in October 2014 with the bond flash crash. This is not the same volatility as a year ago. The end of QE has ushered in a new bond vol regime. 

The second chart compares the VXTYN bond vol index with the VIX stock vol index. Both are on the rise and both had spikes at the same time. There seems to be a common factor which has driven volatility across asset classes. Sell one asset class and you may be buying another risky asset. 

The relative differences in volatility and their changes provide a good foundation for thinking about the stock bond mix for any asset allocation.

Friday, January 30, 2015

Big endowments differ from their smaller counterparts


The big guys embrace diversification through alternative investments. This is the story of endowment asset allocations for 2014 and it seems like this will continue this year. Equity exposure at large university endowments is only 31% versus smaller funds which have 40-55+%. Everyone seems defensive versus the classic 60/40 equity/bond split, but the larger funds do it in a different way. They will have 1/3 the fixed income and 1/3 the equity, but over 2 times the alternative strategies. 

It seems as though this is a discrepancy that should not exist. Hedge funds are more accessible, cheaper and in forms that can be broken into smaller pieces, so it seems as though this issue is worth exploring. With the potential for rates being biased upward over the next few years and with the current equity rally gaining age, an assessment of hedge fund alternative seems appropriate for smaller endowments. 

Is the lower allocations associated with the cost of monitoring and due diligence or an issue of education? Brokers and wealth advisors who serve smaller endowments need better education, fund of funds are expensive and the cost of due diligence is not negligible. The current mix has to change but that has to be in the context of cost and effort. Perhaps the outsourced CIO concept will be the solution, but smaller funds are at risk in the current environment.

DB AWM- hedge fund portfolio weights


Deutsche Bank's asset wealth management (AWM) group has provided their model portfolio for 2015. It generates an interesting look into one group's view of where hedge fund performance will be going. From these weights, there is implied view of the markets. You may not agree with their portfolio logic but it gives a baseline for discussion.

Equity long/short and equity market neutral strategies are net long relative to their equilibrium allocations. This tells me that the AWM group believes equity markets are not going to be great performers, but you want to have a good exposure to this core strategy. Discretionary macro is showing a positive excess allocation yet managed futures (CTA's) is neutral with just a slight upward bias. This is odd given the strong relative performance of CTA's versus their discretionary counterparts over the last year. Allocators still seem to have issues with following trends even when performance is good. There is still a bias toward the discretionary managers.  The big loser is distressed which gets a zero allocation. Credit and event driven are both slightly lower than the equilibrium level.

Avoid credit, distressed, and event strategies and hold more market neutral and discretionary macro styles. This sounds like a defensive strategy which will assumes slower growth, full pricing of credit, and the chance of a lower returns relative to equity and bond benchmarks over the last three years. If there is macro risk, it seems like there should be more managed futures in the portfolio. You want low  or negative correlation to equities given their implied view. 

Sunday, January 25, 2015

Following the crowd with COT traders

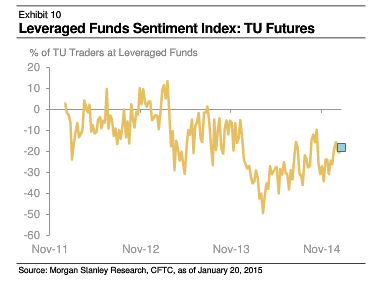
There is always a great desire to look at new measures of market sentiment. The CFTC commitment of traders (COT) has been mined significantly for years to find out what is the sentiment of hedgers, speculators, and small traders. Can the COT forecast price moves? The evidence is mixed,  but it does provide reinforcing information of current market tops and bottoms. It may confirm what is happening with prices. 

There is a new look at this data using the net long and short number of levered traders in the market. Follow the crowd and not the weight of positions. I have mixed feelings on the usefulness of this measure. It does not account for the number of dollar voters, just the number of voters.  Still, this measure seems like it is worth further investigation. When the crowd is moving, it is worth taking a look at where they are going.