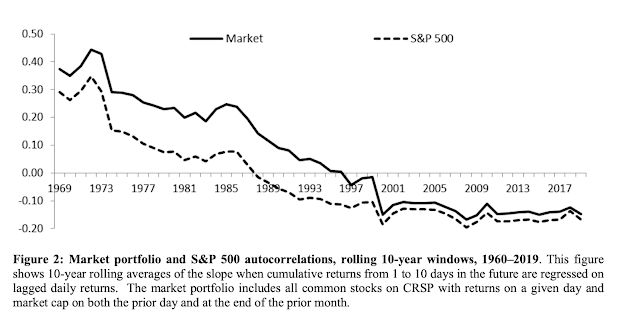
It is very simple rule. It is hard to make money using a trend-following model if there is no positive autocorrelation in returns. It is even more difficult if the asset shows negative autocorrelation. A recent paper looks at 60 years of data to measure the autocorrelation of individual stocks, equity portfolios, and bonds. See "Autocorrelation of stock and bond returns, 1960–2019".
Beyond the implications for trend-following, this work shows that the autocorrelation for stocks and bonds changes through time. For individual stocks, the autocorrelations are always negative, but there is significant ebb and flows in the size of this time series effect. For equity portfolios, the autocorrelations have moved from positive to negative. For bonds, the author finds that autocorrelations have moved from strongly positive to negative like stock portfolios. The paper presents autocorrelation data on portfolios and stocks conditional on factors such as volatility, turnover, and size.
It finds that smaller cap stocks show more negative autocorrelation across all time periods while large caps are closer to random. Lower turnover stocks show more negative autocorrelation. High volatility stocks show more negative autocorrelation.
Small stock portfolios have more positive autocorrelation. Low turnover and low volatility portfolios have more negative autocorrelation.
Any investor has to fight the natural time series behavior of stocks which is to reverse the direction and show negative autocorrelation. Investors should use this tendency to their advantage.


No comments:
Post a Comment