Platinum hits 5 month high on strike in South Africa after Impala Platinum Holdings Ltd announces deliveries will be halved due to a strike at its largest mine. Impala accounts for 25% of output and is second to Anglo American Platinum Ltd which accounts for 40% of production. South Africa accounts for 80% of production and has also been hit by constrained electricity supply which is needed for mining operations. Palladium which is mined along side of Platinum has also been effected. This price increase has closed the gap with gold.
Tuesday, February 28, 2012
Sunday, February 26, 2012
What is the Bank of Japan up to?
On Valentine's Day, the Bank of Japan said that it would add $125 billion to its asset buying program after the economy contracted y 2.3% in the fourth quarter and announced its first trade deficit since 1980. The major cause of the deficit was the earthquake last March, but the Japanese realize that a strong yen and poor growth does nothing to improve the prospects for an aging population that no needs to drawdown savings and wealth. When the trade deficit goes negative, the BOJ will take notice. We may not see a conservative BOJ in 2012. Their action has placed downward pressure on the yen so we are now at 80 form the record low of 75.30 last July.
The dollar and the new oil production in the US
There is a key theme in dollar forecasting over the last 20+ years.
There is a negative correlation between oil and the dollar.
There is a negative correlation between oil and the dollar.
Higher oil prices will cause a dollar drop because the trade deficit will increase given the strong dependency by the US on oil. What happens if the US becomes less oil dependent? The negative correlation that we have generally expected over the last two decades will no longer exist or will be muted. In fact, if the US is less oil dependent, then the value of the dollar will actually increase during an oil crisis because the safety effect will become more important. Clearly the doomsday forecasters concerning the trade deficit will have to adjust their rhetoric because the numbers are looking much more attractive. Current account deficits of 3% are more normal. The flow of oil to different countries has also changed so the dependency on the Middle East has declined. The oil market pricing is now more determined by emerging market demand which will have an effect on the dollar but again we can see more muted effects over the next few years.
Inflation - more than we think?


How do we measure inflation? The simple question has a major impact on policy, yet there does not seem to be a strong emphasis on answering the question. Look at the top graph which is the inflation numbers using the 1990's methodology. The two series have followed the same moves so the numbers will be correlated but the inflation rate is closer to 6%. It does not take into account technological change or value-added for products, but it clearly shows we are paying more for goods if we did not fully take advantage of the basket changes.
The second graph is a longer-term perspective and shows that the inflation differential using a 1980's basket would be even greater. A basket change will bring down inflation as expected but clearly these adjustments may hide the inflation that is taken on if there is not a substitution effect.
Thursday, February 23, 2012
Commodities and the super-cycle

Source: Hackett Financial via Maclean’s
Price return series


There is still talk about a commodity super-cycle. Here are just a few of the super-cycle graphs that have been presented over the last few years to explain the increase in commodity prices. There are some recurring themes:
1. The super-cycles are related to wars when there is strain on commodities. Prices usually decline after the war when those resources are no longer needed.
2. Super-cycles will be associated with large changes in the global economy like the industrial revolution which causes a large increase in demand.
3. Wave theory is suggestive but may not be a good explanation.
We still have the long-term trade-off between Malthusians and Cornucopians. The large increase in demand requires technological progress to avoid "peak-oil" type problems.
Chance of a US recession low


Monday, February 20, 2012
The impact of the Fed on Treasury financing


Who is funding the US budget deficit? It is shocking how the composition of buyers changes through time. In particular, the QE program took on a lot of the new debt produced over the last three years. Take out the flight to quality component and you have to worry where buyers will come from without extra compensation.
The impact on the Treasury market is even greater when you look at the percentage held by different groups in some years. The Fed's exit strategy is not insignificant.
Oil and gas pipeline economics rule refined products


Futures prices have delivery points. The NYMEX oil contract calls for delivery in Cushing Oklahoma while the natural gas contract calls for delivery at the Henry Hub in Louisiana. The NYMEX heating oil and RBOB gasoline have delivery in New York harbor.
The dislocation between WTI and Brent become obvious when you look at pipeline economics. The flow to Cushing cannot get out of the mid-continent given pipeline flows. Refiners closely connected to Cushing will have a significant input advantage. Refined products produced at lower cost cannot get up to the Northeast hence there is a price differential. Profits cannot be made because more expensive oil has to be imported to East coast refiners. They have started to shutdown.
Worldwide debt not just a government problem

The composition of worldwide debt shows that the over-leverage problem is not just a government problem but also a household and corporate issue. The US does not seem to be in too bad abad a shape relative to some other developed countries.
Inflation has momentum

Any way you look at it inflation is on the rise. The momentum is actually quite strong given the output gap that we are facing. Food and energy costs have clearly risen but core rates are also high. It is likely that these rates will reach the early 90's levels, but current inflation does not suggest that we have a deflation problem. Given the inflation target of 2% we are actually close to the Fed's optimal level. Still the momentum is a concern.
Sunday, February 19, 2012
ECB and central banks become more varied lenders of last resort
The ECB is willing to take a greater variety of collateral for lending to different banks. The central banks in the Euro-zone will now allow for a different assets to be pledged which actually adds to confusing about ECB policy. Because the pool of good collateral by some banks has been exhausted there is a need to widen the set available. What is different with this program is that each central bank can tailor the collateral that can be used as pledges within their country. Italy will allow leasing and factoring other central banks will not. Ireland, Portugal, and France will allow residential mortgages.
All banks are not created equal. Each will get to be managed differently. This does not sound like unification.
ta the same time, the ECB has stopped buying sovereign bonds. Thy will take bank collateral but will not buy sovereign debt directly. This is odd.
Energy firms react to low gas prices

Chesapeake is planning to raise $10 billion to help shore up its cash position given the low natural gas prices. It will plan to sell all or part of its Permian basin holdings. It is also selling pipeline and oil service units. Chesapeake is the second largest gas producer behind Exxon Mobil. It is keeping its properties in the other major shale basins.
Chesapeake has been a highly levered gas play around the US and the recent declines in prices has hit short-term cash flows hard. The adjustment of leverage and assets is what should be expected in a market facing dramatic change.
The power of price rationing in cotton

Last year cotton prices hit more than $2 a pound only to see prices tumble to about $.906 for the nearby futures. The expected behavior by farmers is seen in recent crop acreage surveys. US farmers are expected to plant on 13.6 million acres down 7.5% from last year. In those areas where there is greater choice on what can be planted like the US southeast, the decline in closer to 13%.
However, given bad weather there can be a big difference between planted and harvested acres which will be the key driver of price this year. Last year saw one of the greatest divergences between planted and harvested acres because of drought.
Still cotton behaves according to the laws of supply and demand and when there is a lower prices supply will be constrained just a demand was curtailed when cotton was at $2 a pound.
Private equity follows oil price gains
Private equity investments in oil and gas has completed almost $25 billion in deals versus $8.5 in 2010. The value of deals increased by 17%. Oil and gas deals peaked at $65.7 billion in 2007 and then fell off a cliff for the last three years. Merger and acquisition deals increased 3 times form $28.5 billion in 2008 to $106.4 billion in 2011. The bi money may have been made as supply increases and competition stiffens. The next move in oil may be down so assumptions of 10+% gains in price may be overly optimistic.
Saturday, February 18, 2012
Row crop history - the changing distribution of crops


The total number of acres planted with row crops has been fairly steady over the last 30 years. The increase in the late 70's matched the price surge from the bad world harvests in the early 70's. This lead to the farm land bubble and financial disaster in the early 80's. There is a limit to the amount of land that can be planted. There has been urban sprawl which has taken out land. Government conservation land programs have also fluctuated over time. Assuming that there is no new land, the problem with row corp price prediction is determining the relative price based on the substitutability of planting.
The major trend has been the movement to just three major crops in the US, corn soybeans and rice. Corn as a percentage of the total acreage has increased with the development of ethanol production. This has been from a decline in the 60's and 70's. Soybean has been the wonder crop since the end of WWII. Wheat has declined and cotton has been fairly steady. The decline has come at the expense of sorghum, barley, and oats. With higher prices and profits in corn, there will be more substitution to this cash crop. It will come out of the acreage from soybeans which has created the interest in corn soybean spread trades.
Friday, February 17, 2012
The output gap problem


If you wanted to place the Great Recession into perspective, just look at the output gap. The output gap measures the difference between current GDP and trend. In a recession you will fall below trend, but the expectation is that the economy will grow faster in a recovery and then close the gap. This is not going to happen with the US economy anytime soon. We are still years off of getting back to the trend-line.
It is hard to expect higher interest rates or expect inflation to increase significantly if there is a large output gap. It is hard to talk about unemployment falling much further if there is no closing of the output gap. Discussions of tax revenue shortfalls will continue as long as there is an out put gap. The output gap will drive thinking about the potential for reflation of assets.
One graph which shows the risk of the Euro-zone

There clear country risk premiums in the Euro-zone before the development of the single currency. The arrival of the Euro changed Europe and took away all of the risk premium. Credit risk was a thing of the past because there would be constraints on the size of budget deficits. There would be no currency risk inside Europe. There would be no inflation differentials with a single currency. Current account deficits would exist but it would not matter with a single currency. This lasted for less than a decade. Now we are back to risk premiums, inflation differentials, current account deficits, and budget deficits. The world has returned to the 1990's but there will now be single currency. A more structured snake or EMS. However, countries will not have flexibility with their own monetary policy. It is unclear what was gained if we took out the 2000-2008 period.
Why is the middle class stagnating - no innovation

The total factor productivity is a strong measure of overall productivity in the economy. It would include both labor and capital productivity so it serves as a good measure of innovation in the economy. This is not just having workers work harder without compensation which is one form of productivity increase. While the trend was higher during the tech surge, the overall trend is much lower than what occurred during the 50's and 60's. The last 50 years could be considered the Great Stagnation in factor productivity. The last 15 years is better, but not like the old trend line. It is hard to have surges in real income if there is not higher productivity.
Under the Great Stagnation, there will be more fighting over economic resource. Politics will be more important to get your fair share. Government policies should be implemented to improve factor productivity. Innovation should be rewarded. This is a key role of government, not to support big or specific industries but to make sure that innovators are rewarded.
Developing market mercantilist policies in one graph

The international finance story for the last decade is not the financial crisis but the shift in behavior in the current account and official account. Prior to 2000 the current and official accounts were both close to zero. After 2000, developing economies started to show increasing surpluses . This trend was reversed with the Great Recession but has more recently started to move back to the old trend albeit not at the same rate. The net official flows show the significant buying of Treasuries by developing market central banks in order to stop currencies from appreciating. The Great Recession again caused the switch to lower official flows because there was a general depreciation of emerging market currencies when the dollar started to rise in response to the flight to quality. As the global economies started to improve, there was a a surge in Treasury buying. The pattern matches the current account.
The mercantilist policies of emerging markets is the greater theme for the last decade. This had real effects on employment and growth in the US. It also allowed for the strong growth and increase in income levels in developing markets. This is the fight that will continue this decade and will be a major driver in longer-term financial asset levels. Emerging market equities will do well and smaller cap developed market equities may do poorer if they do not have an international focus. Commodities will also do well as income levels continue to surge in emerging markets.
The debt problem and default

As debt goes up, bad things happen around the globe. An increase in the total public debt to GDP is generally not sustainable. There will be defaults and an increase in inflation. Nevertheless, it is not clear what is the timing and link between the two. The turn of the century showed high debt levels and no default. The great Depression was a different period with large defaults. The 1980's was also a very unique and special period with defaults and high inflation. Now we are hitting very high levels of debt but we have yet to see the increases in default and inflation. If history is a guide, it should follow.
Why is there gridlock in Congress?

There is a simple reason for gridlock in Congress. There is no overlap in points of view. Compare the 90th Congress with the 110th Congress. This is a 40 year difference that seems like from another era. This graph normalizes the voting record of Democrats and Republicans and shows that there was a degree of overlap between the two parties 40 years ago. More recently, there is almost no overlap. The parties have become more polarized. This causes gridlock. The only way out of the gridlock is that there has to be politicians who are willing to move outside party norms. Under current conditions, this is unlikely until we have a crisis.
Wednesday, February 15, 2012
Upside for world oil prices

Spare capacity for OPEC
OPEC spare capacity is down 26% in the last year to only 4.685 mm barrels per day. OECD stockpiles climbed only 11.4 million versus a 5-year average of 43.2 mm, so there is less inventory build across the globe. Saudi output, at 9.65 million barrels per day, is slightly down from 30 year highs hit in August.

Saudi oil production
The spare capacity is still large and is not at the low levels seen before the financial crisis. However, the low spare capacity in early 2008 s the period when we saw a large spike in crude oil prices. The decline in spare capacity suggest that growth is increasing, but it also means that if there was a geopolitical event that disrupted the oil markets, prices could go significantly higher.

Brent oil has increased with Libyan problem and now Iranian risk
The global oil market will remain tight under the current environment.
China commits to EU
If you have a large pot of money, you should use it for your own interests. Zhou Xiaochaun, governor of the PBC, stated, " we would participate in resolving the euro debt crisis." They want to support the EU because exports to the Euro-zone exceed those to the US. They can ill afford to have a Euro-zone recession. They said they will hold EU sovereign debt through the IMF, EFSF, and ESM.
International finance statecraft is at work here and and will provide support for the Euro.
Monday, February 13, 2012
Inflation fears should exist - Buffett speaks
(Bloomberg News) Warren Buffett, the billionaire chairman of Berkshire
Hathaway Inc., said low interest rates and inflation should dissuade
investors from buying bonds and other holdings tied to currencies.
“They are among the most dangerous of assets,” Buffett said in an adaptation of his annual letter to shareholders that appeared today on Fortune magazine’s website. “Over the past century these instruments have destroyed the purchasing power of investors in many countries, even as these holders continued to receive timely payments of interest and principal.”
“They are among the most dangerous of assets,” Buffett said in an adaptation of his annual letter to shareholders that appeared today on Fortune magazine’s website. “Over the past century these instruments have destroyed the purchasing power of investors in many countries, even as these holders continued to receive timely payments of interest and principal.”
“High interest rates, of course, can compensate purchasers for the
inflation risk they face with currency-based investments -- and indeed,
rates in the early 1980s did that job nicely,” Buffett wrote. “Current
rates, however, do not come close to offsetting the purchasing-power
risk that investors assume. Right now bonds should come with a warning
label.”
The Oracle has spoken. There is little reason to hold fixed income in this environment. The is a timing issue. You may be able to get more out of fixed income in the short-run if there is another round of QE or if there is a slowdown of growth, but it is hard to see how fixed income could be a good investment in the long-run at current levels. Someone could point to deflation fears as a reason. You could also say that Japan was able to continue with low rates for decades, but the risk is still that purchasing power will be eroded.
The Oracle has spoken. There is little reason to hold fixed income in this environment. The is a timing issue. You may be able to get more out of fixed income in the short-run if there is another round of QE or if there is a slowdown of growth, but it is hard to see how fixed income could be a good investment in the long-run at current levels. Someone could point to deflation fears as a reason. You could also say that Japan was able to continue with low rates for decades, but the risk is still that purchasing power will be eroded.
Saturday, February 11, 2012
The EU credit crunch is upon us

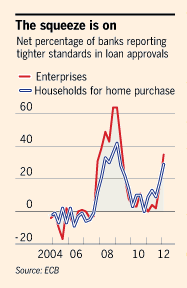
Sometimes there is too much focus on inflation targeting and money growth and not enough on the credit transmission methods. There is a credit crunch in Europe and the ECB has to deal with it. Regulators are going to have to deal with it. ECB lending facilities is a first step but more is going to be required.
Credit standards are tightening not loosening. Corporate lending is negative. This will have ramifications around the globe because of the long reach of EU banks. Banks will usually cut global lending first and start to have a home bias. It is this lending constraint problem that will put pressure on emerging and commodity markets.
Inflation and the Fed


The Fed has set a target for 2% inflation using the PCE as the benchmark. The ability of the Fed to hit a target with consistency has never been high. There is a high likelihood of an overshoot. Currently, the inflation rate is above target but it is unlikely that the Fed will do anything about this excess. Their main concern has always been deflation and even now the setting of the target is a method to stop deflation more than a reason to control inflation at a set level.
The break-even inflation based on nominal and TIPs bonds suggest that inflation expectations are below the target. Given this information, there is room for further expansion of the Fed balance sheet.
Central banks and Treasury buying
The strongest buyers for US Treasuries for the last two years have been central banks, yet this demand is changing with the continued low interest rates. China, Hong Kong, and Russia have all been sellers of Treasuries while Japan, UK and Switzerland have been buyers. More recently, the Swiss have been sellers since setting their currency peg with the Euro. Japan buying was a direct result of intervention which comes in waves.
Foreign holder represent about 48% of the $10 trillion in US Treasuries outstanding. Much of this demand is from central banks. There is less demand for Treasuries when currencies are declining because there is less need to intervene in the foreign exchange markets, but there is also less need for Treasuries at the current low yields. The lower demand for Treasuries from foreign central banks have been offset by Treasury purchase last year. US purchases from Operation Twist negated the lower demand from abroad. The question is what will happen to US yields if there is no central bank buying from any source. If Treasury demand is only a reflection of private demand the volatility and price dynamics of 2012 will be different than last year. Without QE3, there will be more bond volatility.
Thursday, February 9, 2012
Abandoning commodity bets - only if you are looking at past momentum
Barclays Capital measured commodity capital inflows as one of the lowest since 2002 with new money increases of only $15 billion, down from $67 billion in 2010 and $77.1 billion in 2009. Total AUM for commodities is at $399 billion up $19 billion for the year. The commodity inflows were negative after the first quarter of the year. The commodity markets peaked in April of last year, so the momentum for commodities has been negative.
A good portion of this decline is associated with momentum in the commodity markets. With the major commodity markets down relative to equities, there has been a shift back to traditional assets. Nevertheless, inflows have been stronger in 2011 for precious metals. Again this is a momentum story.
Is this the end of the super-cycle? It is unlikely because the fundamental demand for commodities is still strong based the growth in emerging markets. In the current environment, commodities should do well if there is a strong equity market. An strong equity market will signal more risk taking and expectations that economic growth will be stronger.
This does not mean that all commodities will increase as localized effects such as production of US natural gas will cause a decline in prices, but for futures that have a very global reach there should still be upward pressure over the longer run. This should especially be the case for agricultural markets. Again, weather will make some of the localized effects more important but inventory to usage suggests that there is greater risk of stop-outs. additionally, with the Fed setting inflation targets and continuing to force real interest rates negative, there is a strong demand for holding real assets.
An abandonment of the herd in commodity markets does not change the story for holding commodities.
Let the government get a negative yield
The Treasury Borrowing Advisory Committee of the Securities Industry and Financial Markets Association unanimously recommended that the government allow for its auctions of bills to price at negative yields. TIPS have sold for a negative yield at the latest auction for a total of $15 billion.
Negative yields may not be the exception but become more of the norm in the current financial world. There is an incentive for governments to create an environment where yields are negative. First, it obviously cuts down the cost of borrowing. Second, the cost of borrowing any asset is lower and helps debtors. Third, negative yields will force money into riskier assets which may help economic growth. Of course, it may not be good for any economy to have investors blindly reach for yield.
Allowing for negative yields will provide no incentives for the government to cutr budget deficits. It also creates an incentive for governments to increase the cost for investors to hold positive yielding assets. This is a variation on the "financial repression" argument that is growing attention in the markets.
The end of volatilty


It seems like we are falling off the volatility cliff. The end of volatility may be upon us. Looking at some of the key volatility indices for major asset classes, we are finding that low interest rates and significant gains in liquidity is reducing risk in the markets. Look at the VIX index for stock volatility. It has been declining since the announcement of the ECB lending program and the dollar swap lines provided by the Fed. In the fixed income markets, as measured by the MOVE index, there has been a steady decline since November. In the FX markets, the JP Morgan currency volatility index has also been trending lower since the addition of dollar swap lines.
The markets have been signaled that liquidity will be provided to reduce market moves and uncertainty. There has been some resolution of uncertainty and better US economic numbers, but that could lead to higher volatility on the upside. Another story would suggest that central banks do not want any dramatic fall in a asset prices, but the market is not willing to fully increase its level of optimism.
Clearly, there has been a significant gain in financial markets over the last three months, but market gains do not translate to lower volatility. The central banks want more stability because that should improve market flows. Interest rates on the front-end cannot go any lower and there is not enough strength for them to move higher. Currency markets through intervention is reducing volatility. In equity markets, the bets is more one-way because of the improved liquidity.
Clearly, there has been a significant gain in financial markets over the last three months, but market gains do not translate to lower volatility. The central banks want more stability because that should improve market flows. Interest rates on the front-end cannot go any lower and there is not enough strength for them to move higher. Currency markets through intervention is reducing volatility. In equity markets, the bets is more one-way because of the improved liquidity.
The low volatility is inconsistent with the view that there are significant macro risks. This cannot last for the longer-term because many of deleveraging problems by governments and consumers have not been solved.
Subscribe to:
Posts (Atom)